The stock market performance under Trump vs Biden has become a focal point for investors, policymakers, and political analysts seeking to understand how presidential leadership influences economic outcomes. While markets respond to countless variables beyond any single administration's control, comparing these two presidencies offers valuable insights into how policy decisions, global events, and economic conditions shape investor confidence and market returns. This analysis examines the data, contextualizes the results, and explores the fundamental factors that drove market performance during each administration.
Understanding Presidential Impact on Market Returns
Presidential administrations establish the policy framework within which businesses operate, yet attributing market performance solely to White House occupants oversimplifies complex economic realities. The stock market responds to monetary policy, corporate earnings, technological innovation, demographic shifts, and global economic conditions that extend far beyond presidential control.
Research from the National Bureau of Economic Research examining stock-return patterns across presidencies demonstrates that while correlations exist between administrations and market performance, establishing clear causation remains challenging. Markets often anticipate policy changes months before implementation, and the lag between policy enactment and economic impact can span years.
Key Factors Beyond Presidential Control
Several critical variables influence stock market performance under Trump vs Biden that neither president directly controlled:
- Federal Reserve monetary policy decisions regarding interest rates and quantitative easing
- Global economic conditions including international trade dynamics and foreign market performance
- Technological disruption driving productivity gains and new market opportunities
- Pandemic-related disruptions affecting supply chains, consumer behavior, and business operations
- Corporate innovation and earnings growth independent of government policy
The Federal Reserve's independence means that monetary policy operates separately from executive branch preferences, though presidents do appoint Fed chairs who serve extended terms.

Trump Administration Market Performance (2017-2021)
The Trump presidency began in January 2017 following an election that significantly impacted individual company valuations based on expected policy changes. According to NBER research on how the 2016 election affected stock prices, companies anticipated to benefit from deregulation and tax cuts experienced immediate valuation increases.
Annual Returns and Cumulative Performance
The S&P 500 delivered strong returns during most of the Trump administration, with notable volatility in 2018 and a sharp decline in early 2020.
| Year | S&P 500 Total Return | Key Events |
|---|---|---|
| 2017 | +21.8% | Tax Cuts and Jobs Act passed |
| 2018 | -4.4% | Trade tensions, Fed rate hikes |
| 2019 | +31.5% | Trade deal optimism, Fed pivot |
| 2020 | +18.4% | COVID crash and recovery |
The cumulative S&P 500 return during Trump's four-year term reached approximately 67%, representing strong performance despite the pandemic-induced March 2020 crash that saw markets decline over 30% in weeks.
Policy Drivers of Trump-Era Performance
Several Trump administration policies directly influenced market sentiment and corporate profitability:
Tax Reform: The 2017 Tax Cuts and Jobs Act reduced the corporate tax rate from 35% to 21%, immediately boosting after-tax earnings and increasing the present value of future corporate cash flows. This policy alone accounted for significant earnings per share growth across the S&P 500.
Deregulation: Rolling back financial regulations, environmental standards, and industry-specific rules reduced compliance costs for many sectors. Energy companies particularly benefited from relaxed environmental restrictions.
Trade Policy: While imposing tariffs created uncertainty, renegotiating NAFTA into USMCA and reaching phase-one trade agreements with China provided occasional market rallies. However, ongoing trade tensions contributed to 2018's negative returns.
Biden Administration Market Performance (2021-2026)
President Biden took office in January 2021 amid unique economic circumstances, including ongoing pandemic recovery, unprecedented fiscal stimulus, and historically low interest rates. The stock market performance under Trump vs Biden shows distinctly different challenges and opportunities.
Annual Returns Through Current Period
Biden's presidency has seen significant market volatility, including a bear market in 2022 followed by recovery.
| Year | S&P 500 Total Return | Key Events |
|---|---|---|
| 2021 | +28.7% | Continued stimulus, vaccine rollout |
| 2022 | -18.1% | Inflation surge, Fed tightening |
| 2023 | +26.3% | AI boom, inflation moderation |
| 2024 | +25.0% | Soft landing optimism |
| 2025 | +14.2% | Continued expansion |
| 2026* | +8.1% | Year-to-date through October |
*2026 figures represent partial-year performance through October 17, 2026.
The cumulative performance through October 2026 shows the S&P 500 up approximately 102% since Biden took office, though this includes recovery from the 2022 bear market.

Biden-Era Policy Impacts on Markets
The Biden administration pursued markedly different policy priorities than its predecessor, creating distinct market dynamics:
Fiscal Stimulus: The American Rescue Plan, Infrastructure Investment and Jobs Act, and CHIPS Act injected trillions into the economy. While supporting growth, these measures contributed to inflation concerns that pressured markets in 2022.
Regulatory Expansion: Increased focus on environmental regulations, antitrust enforcement, and corporate governance created headwinds for certain sectors while benefiting clean energy companies.
China Policy: The Biden administration maintained and expanded technology export controls while continuing strategic competition. Analysis of Biden’s China policy approach reveals continuity with Trump-era concerns but different implementation strategies affecting semiconductor and technology stocks.
Comparative Analysis of Market Drivers
When examining stock market performance under Trump vs Biden, distinguishing between policy effects and external factors becomes essential for accurate assessment.
Inflation and Interest Rate Environments
The most significant difference between these presidencies involves inflation and the resulting Federal Reserve response.
Trump Era: Inflation remained subdued throughout most of the administration, averaging below 2% annually until 2021. The Fed maintained accommodative policy, cutting rates in 2019 and implementing emergency measures during the pandemic.
Biden Era: Inflation surged to 40-year highs in 2022, reaching 9.1% year-over-year, forcing the Federal Reserve to implement the most aggressive tightening cycle in decades. This created significant market volatility and the 2022 bear market.
According to State Street Global Advisors’ market forecast analysis, the current environment reflects normalization after extraordinary pandemic-era policies, with institutional investors focusing on sustainable growth metrics rather than stimulus-driven gains.
Sector Performance Variations
Different sectors performed distinctly under each administration based on policy priorities:
- Energy: Outperformed under Trump due to deregulation, struggled initially under Biden before recovering with oil price increases
- Technology: Strong under both administrations, with Biden-era AI developments driving recent gains
- Financials: Benefited from Trump-era deregulation, faced headwinds from Biden-era antitrust focus
- Clean Energy: Underperformed during Trump years, gained significantly under Biden's climate initiatives
- Healthcare: Faced uncertainty under both administrations due to different reform proposals
The U.S. Presidential Report’s coverage of economy and tax policy provides ongoing analysis of how presidential priorities shape sector-specific outcomes.
Valuation and Earnings Dynamics
Stock prices reflect the present value of future earnings, making corporate profitability a crucial driver regardless of administration.
Corporate Earnings Growth
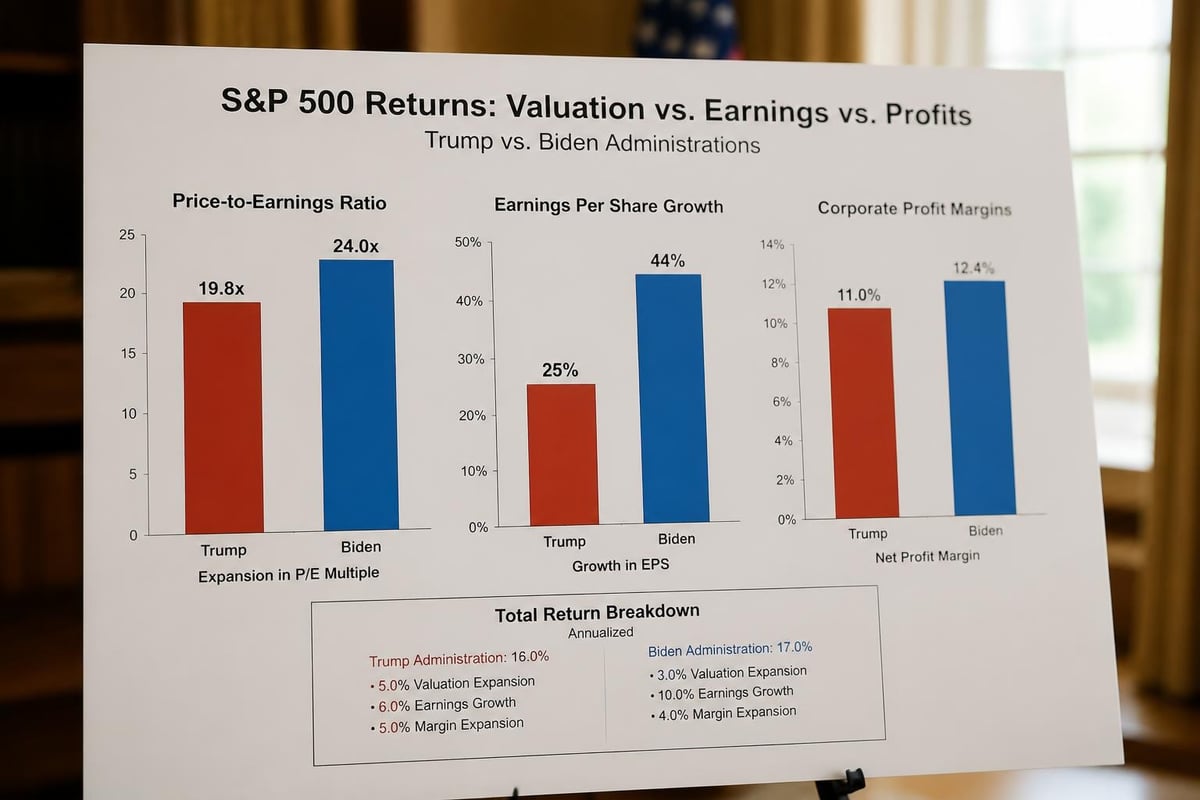
Trump-era earnings received a significant boost from tax reform. S&P 500 operating earnings per share grew from approximately $110 in 2016 to $139 in 2019, before pandemic disruptions. The effective tax rate reduction directly contributed roughly 15-20% of this growth.
Biden-era earnings have grown despite higher taxes on some corporations and increased regulatory costs. S&P 500 earnings reached record levels by 2024, driven by technology sector dominance, productivity improvements, and economic resilience. Through 2026, earnings continue growing at mid-single-digit rates.
Valuation Multiple Expansion
Both administrations saw valuation multiple expansion, though driven by different factors:
- Trump period: P/E ratios expanded from approximately 17x to 22x by late 2019, driven by tax reform, deregulation optimism, and low interest rates
- Biden period: After contracting in 2022 to approximately 15x, multiples expanded to 24x by mid-2026, supported by AI enthusiasm, earnings resilience, and expectations of sustained economic growth
First Trust’s analysis of S&P 500 returns following presidential elections demonstrates that new presidents often see strong first-year returns, which occurred under both Trump and Biden.
External Shocks and Market Resilience
Both administrations faced significant external challenges testing market resilience and policy responses.
The COVID-19 Pandemic
The pandemic's March 2020 onset created the fastest bear market in history, with the S&P 500 declining 34% in 33 days. The Trump administration's response included:
- CARES Act providing $2.2 trillion in fiscal stimulus
- Federal Reserve emergency measures including unlimited quantitative easing
- Operation Warp Speed accelerating vaccine development
Markets recovered rapidly, regaining pre-pandemic levels by August 2020, demonstrating resilience supported by unprecedented policy intervention.
The 2022 Inflation Surge
Biden's most significant market challenge came from inflation reaching levels unseen since the early 1980s. Contributing factors included:
- Supply chain disruptions from pandemic-era policies
- Fiscal stimulus increasing money supply and aggregate demand
- Energy price shocks from geopolitical tensions
- Labor market tightness driving wage inflation
The Federal Reserve's response-raising rates from near-zero to over 5%-created the 2022 bear market. However, the economy's subsequent soft landing, with declining inflation and sustained growth, supported market recovery through 2026.
Historical Context and Partisan Performance Patterns
Examining stock market performance under Trump vs Biden within broader historical context reveals important patterns. The Federal Reserve Bank of San Francisco’s analysis of whether markets prefer Republican administrations found no consistent partisan advantage when controlling for economic conditions.
Long-Term Presidential Comparisons
Historical data shows strong market performance under presidents of both parties:
- Clinton (D): S&P 500 up 210% (1993-2001)
- Bush (R): S&P 500 down 11% (2001-2009, including financial crisis)
- Obama (D): S&P 500 up 182% (2009-2017)
- Trump (R): S&P 500 up 67% (2017-2021)
- Biden (D): S&P 500 up 102% through October 2026
For more context on previous presidential economic records, the patterns suggest that starting conditions, Federal Reserve policy, and global economic trends often matter more than partisan affiliation.
Investment Implications and Lessons
For investors seeking to understand stock market performance under Trump vs Biden, several practical lessons emerge from this comparative analysis.
Avoid Timing Markets Based on Elections
Research consistently shows that maintaining portfolio discipline through political transitions yields better results than tactical adjustments based on election outcomes. Reuters analysis of how markets priced the 2024-2025 election cycle demonstrates that anticipated policy changes often get priced in months before implementation, making timing difficult.
Focus on Fundamentals Over Politics
Corporate earnings, valuation levels, and economic conditions provide more reliable investment signals than political affiliation. Both administrations saw strong market performance during periods of earnings growth and reasonable valuations.
Consider Sector Rotation Opportunities
Policy priorities create sector-specific opportunities and risks. Understanding presidential agendas allows investors to position portfolios accordingly:
- Energy policy shifts affect traditional and renewable energy stocks
- Tax policy changes impact high-tax versus low-tax sectors
- Regulatory approaches create winners and losers across industries
- Trade policy affects multinational corporations differently than domestic-focused companies
The U.S. Presidential Report’s political coverage helps investors stay informed about policy developments affecting market sectors.
Market Expectations and Forward-Looking Perspectives
As of October 2026, markets continue processing the implications of both recent and anticipated policy changes. The stock market performance under Trump vs Biden debate increasingly focuses on which policies proved most sustainable and beneficial for long-term economic health.
Current Market Positioning
Institutional investors currently emphasize several themes regardless of political considerations:
- Artificial intelligence and technology innovation driving productivity gains
- Energy transition creating opportunities across traditional and renewable sectors
- Infrastructure modernization benefiting construction, materials, and engineering firms
- Reshoring and supply chain resilience supporting domestic manufacturing
- Healthcare innovation advancing despite regulatory uncertainty
Lessons for Future Administrations
The comparative analysis reveals that successful market outcomes under any administration require:
- Predictable policy frameworks reducing uncertainty for business investment
- Balanced fiscal approaches supporting growth without triggering inflation
- Regulatory clarity allowing companies to plan long-term strategies
- International cooperation maintaining stable trade relationships
- Monetary-fiscal coordination ensuring complementary rather than conflicting policies
Investors tracking presidential race developments should focus on these fundamentals when assessing potential market impacts of future administrations.
Measuring Success Beyond Simple Returns
While headline returns provide convenient comparison points, comprehensive assessment of stock market performance under Trump vs Biden requires examining market breadth, volatility, and risk-adjusted returns.
Market Breadth and Participation
Trump Era: Market gains concentrated in large-cap technology stocks, with smaller companies and value stocks lagging. The equal-weighted S&P 500 underperformed the cap-weighted index, indicating narrow leadership.
Biden Era: Similar concentration in mega-cap technology companies, particularly AI beneficiaries. However, 2023-2026 saw periodic rotation into small-caps and value stocks as economic resilience became apparent.
Volatility Considerations
The VIX (volatility index) averaged approximately 16 during non-pandemic Trump years, spiking to 80 during March 2020. Under Biden, volatility averaged higher at approximately 20, reflecting inflation uncertainty, Fed policy shifts, and geopolitical tensions.
Lower volatility generally indicates investor confidence, though it can also signal complacency. Both administrations experienced volatility spikes during crisis periods, with recovery depending on policy responses and external developments.
The stock market performance under Trump vs Biden reflects distinct policy approaches, different economic challenges, and varied external shocks rather than simple partisan advantages. Both administrations presided over significant gains when measured across their full terms, demonstrating that markets can thrive under different policy frameworks when corporate earnings grow and monetary conditions remain supportive. For comprehensive, non-partisan analysis of how presidential policies affect economic outcomes and market performance, U.S. Presidential Report provides ongoing coverage of current and past administrations, helping readers understand the complex relationship between political leadership and financial markets.