Economic worries still lead democracy concerns among American voters in most surveys, but the gap is narrower than headlines suggest, and the two issues increasingly overlap. Gallup and Pew data show large majorities anxious about prices and costs, while a similar majority is dissatisfied with how American democracy is working. Understanding economy vs democracy concerns among American voters requires looking at what each group of worries actually measures, who holds them, and how they shape voting decisions.
What Do Polls Say Voters Worry About Most?
Polls consistently place cost-of-living issues at the top of voter anxiety, with democracy and governance concerns close behind. The strongest evidence comes from two long-running survey programs, and the two agree more than they differ.
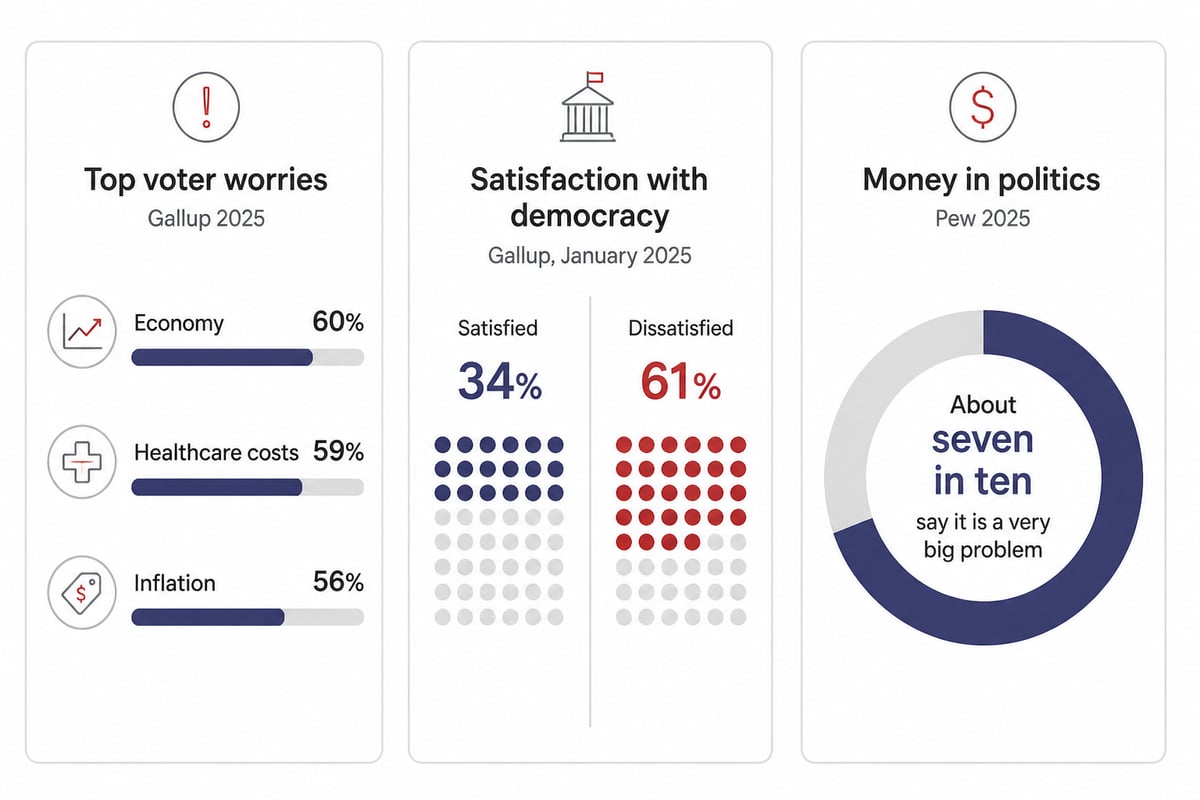
In Gallup’s March 2025 survey of 1,002 U.S. adults, 60% said they worried a great deal about the economy, 59% about healthcare costs, and 56% about inflation. The margin of sampling error was plus or minus 4 percentage points, so these three issues sit within a statistical band of each other. Reading them as a ranking would overstate what the data can support. They are better understood as one cluster of money-related worry, with the economy, healthcare bills, and prices all drawing roughly the same level of anxiety.
Pew's findings point the same direction. In its early 2025 survey, 67% called healthcare affordability a very big national problem, 63% said the same of inflation, and 57% of the federal budget deficit. Economic ratings were weak as well: 45% described the economy as only fair and 31% as poor. Together, those two answers mean about three-quarters of adults gave the economy a middling or negative grade, with very few offering a positive one.
The pattern is steady across years. Pew's May 2024 survey found that 62% called inflation a very big problem, and only 23% rated the economy excellent or good. Consistent readings across different years, samples, and organizations make this one of the more reliable findings in public opinion research.
How Concerned Are Voters About the State of Democracy?
Voter concern about democracy is substantial and measurable, though it tends to register as dissatisfaction with performance rather than as a single named crisis. Gallup reported in January 2025 that 34% of Americans were satisfied with how democracy was working in the U.S., while 61% were dissatisfied.
Open-ended questions reveal a similar theme. In Gallup's May 2025 survey, when respondents named the country's most important problem in their own words, 26% cited poor governance or leadership. That was more than the 16% who named the economy in general and the 8% who named inflation. Governance, in other words, can outrank any single economic label when voters answer without a prompt list.
Pew adds another data point. About seven in ten Americans considered the role of money in politics a very big problem, the highest share among the 24 issues tested in its 2025 survey. That finding shows democracy concerns are not abstract. They attach to specific features of how campaigns and policy are funded.
Economy vs Democracy Concerns Among American Voters: Why the Comparison Is Tricky
The comparison is tricky because the two categories are measured differently, which can make one look larger than the other. Economic worry is usually asked as a prompted list, where respondents rate how much each item concerns them. Democracy concern often appears as satisfaction ratings or as a write-in answer.
That difference matters in three ways:
- Prompted worry inflates economic numbers. When pollsters read out "inflation," "healthcare costs," and "the economy" as separate items, each draws high scores, and together they form a broad cost-of-living cluster.
- Open-ended answers split the economy apart. When voters volunteer a problem, economic concerns divide among inflation, jobs, wages, and general economic mentions, while governance stays one bucket.
- Intensity differs from breadth. A voter can be dissatisfied with democracy yet rank groceries as the issue that decides a vote.
The practical takeaway for anyone reading poll coverage is to check the question wording before comparing headline percentages. For a broader look at how issue rankings are shifting this year, see top political issues Americans care about in 2026.
Why Household Costs Dominate Voting Decisions
Household costs dominate because voters experience them weekly, while democratic stress is felt mostly through news and institutions. A grocery receipt, a rent payment, or an insurance premium arrives with a specific number attached, and voters can compare it with what they paid a year earlier. Pew's data on specific expenses shows how concrete the worry is: most Americans say they are very concerned about food and consumer-goods prices and housing costs.
Gallup's economic ratings add context on direction. In May 2025, 23% rated current economic conditions excellent or good, 38% called them only fair, and 37% poor. A further 58% said conditions were getting worse. Voters who believe things are deteriorating tend to weigh economic performance heavily when judging incumbents, because the judgment rests on personal experience and not on an abstract argument. The fact that 75% rated conditions only fair or poor also means a candidate cannot count on a favorable baseline.
Pew's policy-priority research shows how this translates into expectations. Pew's policy-priority research found that strengthening the economy is a top priority for the president and Congress. That kind of consensus rarely exists for any democracy-related goal, which tends to split along partisan lines. A priority shared across party lines gives economic performance unusual weight as a yardstick, since both supporters and opponents of an administration are watching the same measure.
Readers tracking the political fallout can follow our coverage of affordability issues versus inflation concerns among voters and why voters care so much about grocery prices.
Where the Two Concerns Overlap
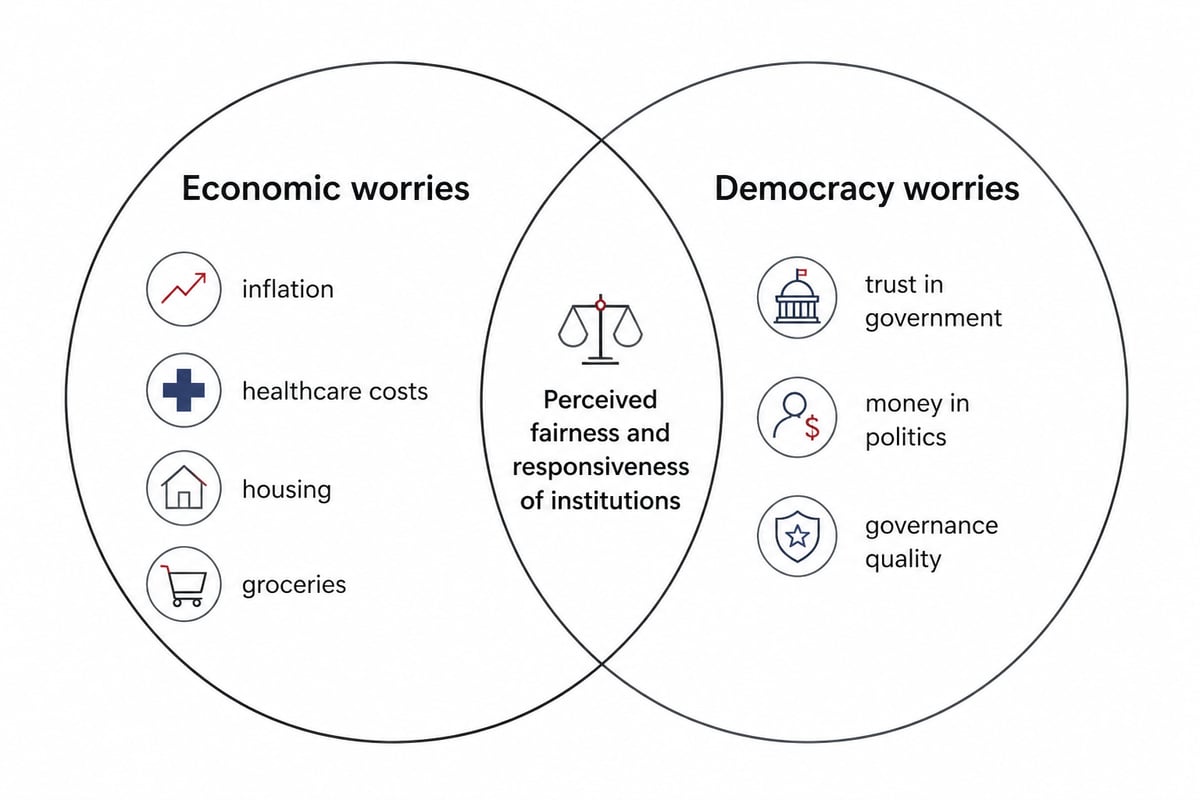
Economic and democratic concerns overlap most clearly in questions about who benefits from policy and who has influence over it. The Pew finding on money in politics is the clearest bridge. A voter who worries about healthcare costs and also believes donors shape legislation is expressing a single grievance in two vocabularies. The first describes the symptom, a bill that is too high, and the second names the suspected cause, a policy process that does not answer to ordinary people.
Several threads connect the two issues:
- Trust in institutions. Dissatisfaction with democracy often accompanies the belief that government does not respond to cost pressures. With 61% dissatisfied in Gallup's January 2025 reading, a voter who sees prices rising while officials debate other topics may read the mismatch as proof that the system is not working for them.
- Policy credibility. Tariff and tax decisions are judged on economic results, but also on whether voters feel consulted. Our reporting on tariffs and rising prices shows how a trade policy debate becomes a governance debate.
- Perceived fairness. Complaints about affordability frequently carry a belief that the system favors insiders. Pew's finding on money in politics, the top-ranked problem of 24, gives that belief a measurable footprint.
This overlap helps explain why a "pocketbook versus democracy" framing can mislead. For many voters, a weak economy is evidence that institutions are failing, and weak institutions are a reason to expect a weak economy. A campaign that speaks to only one half of that loop may leave the other half, and the voters who hold it, unaddressed.
How Concerns Differ by Voter Group
Voter groups rank these concerns differently, and the differences shape campaign strategy. Age, partisanship, and economic position all matter. The same national numbers can hide very different experiences: a renter in her twenties watching housing costs, a retiree facing medical bills, and a self-described independent who distrusts both parties may all tell a pollster they are worried, for different reasons.
| Voter group | Typical emphasis | What the research suggests |
|---|---|---|
| Young voters | Economy and health care | Those who say they are falling behind economically lean toward Democrats in some surveys |
| Independents | Governance and cost of living | Often decide close races and respond to results over party loyalty |
| Working-class voters | Prices, wages, job security | Cost pressures have moved some away from traditional party ties |
| Older voters | Healthcare costs, Social Security | Gallup recorded sharp worry increases on both topics in 2025 |
For campaigns, the table points to different messages for different audiences. Independents, who lack a party label to anchor their choice, are the group most likely to judge candidates on delivered results and on whether government appears to function. Working-class voters tend to evaluate leaders through paychecks and prices, so loyalty built over decades can weaken when household budgets tighten. Older voters bring a distinct set of concerns, since Social Security and medical costs are tied directly to federal policy decisions.
Our analysis of independent voters versus party loyalists explains why this bloc is so sensitive to both economic results and governance performance. Related reporting covers why Democrats are losing working-class voters and why young voters are leaving Democrats.
Reading Poll Numbers Without Overreading Them
Poll figures are most useful when readers account for timing, sample size, and wording. Several practical habits improve interpretation.
- Check the margin of error. A 60% versus 56% gap in a 1,002-person survey with a four-point margin is not a meaningful difference.
- Separate worry from priority. Concern about an issue does not always translate into a voting priority.
- Watch the trend, not one release. Gallup's satisfaction-with-democracy series and Pew's economic ratings are most informative across several waves.
- Note the question format. Prompted lists and write-in answers produce different rankings, as the Gallup governance figure shows.
For historical context on how economic conditions have shaped past elections, Historic Financial News offers interactive charts and summaries that place market and economic events in a longer timeline. Voters comparing past administrations may also want our reporting on the best economy under recent presidents.
Tax questions sit squarely between the two concerns, since they affect household budgets and also reflect how policy is made. Readers facing a personal tax dispute can consult a specialist such as tax attorney Jorge Alesna, Jr. for representation in IRS and California tax matters, and those studying how fiscal policy is debated can start with our economy and tax policy coverage.
What This Means for the Next Election Cycle
The evidence points to an electorate that treats economic performance as the main test of leadership while holding a persistent, widely shared unease about how democratic institutions function. Economic anxiety is broader and more uniform. Democratic dissatisfaction is deep but divided by party on its causes and remedies.
For candidates and observers, three implications follow:
- Cost-of-living messaging reaches the widest audience, because concern spans partisan lines.
- Governance and integrity themes carry weight with voters who are already dissatisfied, particularly on money in politics, an issue with unusually high agreement.
- Results matter more than rhetoric. Gallup's finding that 58% believed economic conditions were worsening shows how quickly sentiment can turn against whoever holds office.
Readers who want to follow how these dynamics play out can monitor our ongoing democracy coverage, which tracks the issues alongside economic developments. Academic readers interested in the policy and legal dimensions of these debates can also explore programs in law and business at the University of Gold Coast.
Take ten minutes this week to read the question wording behind the next poll you see, then compare it with the trend in earlier releases. For daily, non-partisan reporting on the presidency, Congress, and federal policy that shapes these numbers, visit U.S. Presidential Report and Start Your Own Political Club to discuss the issues with other informed readers.