North Carolina has evolved into one of America's most competitive political battlegrounds, with margins in recent presidential and statewide races rarely exceeding single digits. As the 2026 midterm elections approach, understanding north carolina election predictions requires analyzing a complex mix of demographic shifts, redistricting outcomes, voter registration trends, and national political currents. The state's unique position-bridging the traditional South with rapidly growing metropolitan areas-makes it a critical indicator for broader electoral trends affecting presidential and congressional politics nationwide.
The Evolving Electoral Landscape
North Carolina's political transformation over the past two decades has been driven by unprecedented population growth and demographic change. The Research Triangle and Charlotte metropolitan areas have attracted educated professionals from across the country, creating Democratic-leaning urban cores surrounded by competitive suburban counties. Meanwhile, rural areas have trended increasingly Republican, setting up a geographic and cultural divide that defines modern north carolina election predictions.
The state's population grew by more than 10% between 2016 and 2026, with the bulk of that growth concentrated in Wake, Mecklenburg, and Durham counties. These areas now comprise a larger share of the statewide electorate, fundamentally altering the calculus for candidates in both parties. Urban turnout rates and suburban swing voter behavior have become the two most critical variables in forecasting election outcomes.
Registration Trends and Party Dynamics
Recent registration data from the North Carolina State Board of Elections reveals important shifts in partisan affiliation and voter demographics. Unaffiliated voters now represent the fastest-growing segment of the electorate, surpassing 35% of registered voters in several suburban counties. This bloc's preferences often determine election outcomes in competitive races.
| Voter Category | 2022 Share | 2026 Projected Share | Key Trend |
|---|---|---|---|
| Registered Democrats | 34% | 32% | Declining share, stable absolute numbers |
| Registered Republicans | 30% | 29% | Slight decline in metro areas |
| Unaffiliated/Independent | 36% | 39% | Fastest growth segment |
Democrats maintain a registration advantage, but that edge has narrowed considerably since 2016. More importantly, voting behavior has decoupled from registration in many counties, with registered Democrats in rural areas increasingly voting Republican in federal races while registered Republicans in suburban areas sometimes split tickets.

Key Races and Competitive Dynamics in 2026
The 2026 cycle features a Senate race, a gubernatorial contest, and multiple competitive House districts that will test various north carolina election predictions. Each race operates within its own dynamics while also reflecting broader national trends and state-specific factors.
The Senate Battle
North Carolina's Senate race has attracted national attention and significant campaign resources from both parties. The incumbent faces a challenging re-election environment shaped by presidential approval ratings, economic conditions, and state-specific issues including education funding and infrastructure investment.
Polling averages through September 2026 show a tight race within the margin of error. Historical patterns suggest that Senate races in North Carolina tend to track presidential approval ratings closely, with the party controlling the White House typically facing headwinds in midterm elections. The 2014 and 2022 cycles demonstrated this pattern clearly.
Candidates' ability to perform in the Charlotte and Raleigh-Durham media markets will largely determine the outcome. These expensive advertising environments require substantial fundraising, and early financial reports indicate both campaigns have built significant war chests. Voter contact operations in suburban swing counties-particularly Union, Cabarrus, Johnston, and Chatham-will prove decisive.
Gubernatorial Contest Dynamics
North Carolina's gubernatorial race operates somewhat independently from federal political currents. The state has a history of ticket-splitting, electing governors from the opposite party of their presidential choice. This pattern creates unique opportunities and challenges for north carolina election predictions at the state level.
The race features debates over education policy, Medicaid expansion, economic development, and response to climate-related weather events. These state-specific issues can insulate the contest from national partisan waves. Candidates who successfully localize their message and demonstrate competence on kitchen-table issues typically outperform generic partisan expectations.
Rural-urban divides in policy priorities create strategic challenges for both campaigns. Urban voters prioritize public transit, affordable housing, and environmental regulations, while rural voters focus on agricultural policy, broadband expansion, and Second Amendment rights. Building a winning coalition requires carefully calibrated messaging across these distinct constituencies.
Demographic and Geographic Factors
Understanding north carolina election predictions requires deep analysis of demographic trends and their geographic distribution. The state's diversity-racial, educational, generational, and economic-creates complex voting patterns that simple partisan models often miss.
The Suburban Transformation
Suburban counties surrounding Charlotte and Raleigh have undergone dramatic political shifts. Areas that voted reliably Republican in the 2000s now feature competitive races where candidates from both parties can win depending on national environment and candidate quality. This transformation reflects educational polarization, with college-educated professionals trending Democratic while working-class voters shift Republican.
Research from the Pew Research Center on voting patterns shows these educational divides cutting across racial and regional lines. In North Carolina, counties with higher concentrations of bachelor's degree holders have trended 8-12 points more Democratic since 2012, even when controlling for other demographic variables.
Key suburban indicators include:
- Homeownership rates and housing price appreciation
- School district quality ratings and education funding debates
- Transportation infrastructure and commute patterns
- Small business formation and commercial development
These factors influence voter priorities and partisan preferences in ways that traditional demographic models sometimes overlook. Campaigns that address these localized concerns effectively gain crucial advantages in persuasion and mobilization.
Generational Shifts and Youth Turnout
Younger voters in North Carolina lean significantly more Democratic than older cohorts, but their participation rates remain lower. The 18-29 age group comprises roughly 16% of the eligible electorate but typically accounts for only 10-12% of actual voters in midterm elections. Mobilization efforts targeting college campuses and younger workers could shift close races by 1-2 percentage points.
The state's growing college-educated population intersects with generational trends in complex ways. Many young professionals moving to North Carolina from other states bring different political orientations than native Carolinians of similar demographics. This in-migration effect particularly influences urban and inner-suburban precincts.
Methodology and Forecasting Approaches
Accurate north carolina election predictions depend on rigorous methodology that incorporates multiple data sources and accounts for known biases in polling and demographic projections. Professional forecasters employ sophisticated models that go far beyond simple poll aggregation.
Data Sources and Quality Assessment
The foundation of any credible forecast includes voter file analysis, historical precinct results, and properly weighted survey research. The MIT Election Data and Science Lab provides standardized precinct-level returns that enable granular analysis of voting patterns and turnout trends. These micro-level data reveal patterns that county-level aggregates obscure.
Quality polling requires representative samples with appropriate demographic weights, transparent methodology disclosure, and careful attention to likely voter screens. Many observers critique horse-race polling while ignoring the more valuable components: approval ratings, issue salience, and voter priorities. These metrics often prove more predictive than head-to-head matchups months before an election.
Critical methodological considerations include:
- Sample composition and weighting: Ensuring polls reflect actual likely voter demographics
- Question wording and order effects: Recognizing how survey design influences responses
- Mode effects: Understanding differences between live-caller, IVR, and online surveys
- Herding and bias: Identifying when pollsters adjust results toward consensus forecasts
- Non-response patterns: Accounting for differential response rates across partisan groups
Modeling Electoral Outcomes
Sophisticated forecasters build ensemble models that combine polling, historical patterns, economic indicators, and fundraising data. No single input drives these models; instead, they synthesize diverse information sources with appropriate uncertainty quantification. Understanding prediction intervals matters as much as point estimates-a race forecast at 52-48% with high uncertainty differs meaningfully from the same margin with tight confidence intervals.
For more context on how broader presidential politics shapes state-level races, understanding the national environment proves essential. Presidential approval ratings, generic congressional ballot polling, and perceptions of economic conditions create headwinds or tailwinds for candidates regardless of individual campaign quality.
| Model Component | Weight in Forecast | Data Sources | Update Frequency |
|---|---|---|---|
| Polling average | 40% | Reputable pollsters (A/B rated) | Weekly |
| Historical patterns | 25% | Precinct results 2016-2024 | Static baseline |
| Demographic projections | 20% | Voter file, Census data | Monthly |
| Economic indicators | 10% | Jobs, income, consumer sentiment | Monthly |
| Fundraising & organization | 5% | FEC reports, field operations | Quarterly |
Legal and Administrative Factors
North carolina election predictions must account for ongoing legal battles and administrative changes affecting voting access, ballot counting procedures, and post-election processes. The state has experienced significant litigation over voting laws, redistricting, and election administration since 2013.
Voting Law Changes and Court Battles
Recent years have seen multiple court challenges to North Carolina election laws. Research from the Brennan Center on voting laws documents how legislative changes and judicial rulings affect voter registration, early voting periods, ID requirements, and absentee ballot procedures. These changes can influence turnout patterns and create implementation challenges for election officials.
The Brookings Institution’s analysis of state election rules provides important constitutional context for understanding how redistricting and election administration disputes shape the electoral environment. North Carolina features prominently in these discussions due to its history of competitive redistricting battles and innovative legal arguments about state legislative power.
Administrative capacity at county boards of elections varies considerably across North Carolina's 100 counties. Well-resourced urban counties process ballots efficiently with modern equipment and sufficient staff, while some rural counties face budget constraints and personnel challenges. These disparities occasionally create delays in reporting results and processing provisional ballots.
Redistricting Impact
The current congressional and state legislative district maps reflect legal battles and compromise agreements that significantly affect competitive dynamics. Several House districts feature highly competitive partisan indices, while others lean safely toward one party. The specific boundaries drawn in suburban areas-how precincts are combined and communities of interest defined-can shift expected outcomes by several percentage points.
North carolina election predictions for congressional races require district-by-district analysis rather than statewide aggregation. The correlation between statewide political environment and individual district outcomes has weakened as district lines become more carefully engineered. A strong statewide showing for one party may translate to only modest seat gains if the most competitive districts have offsetting local factors.

Economic Conditions and Issue Salience
Voter priorities and economic perceptions heavily influence election outcomes independent of partisan identity or demographic category. North carolina election predictions must therefore incorporate economic data and issue polling to capture these cross-cutting factors.
Economic Indicators and Voter Perceptions
The state's economy features diverse sectors including technology, finance, manufacturing, agriculture, and tourism. Regional economic conditions vary considerably-the Research Triangle's tech-driven growth contrasts sharply with manufacturing decline in some Piedmont communities and agricultural challenges in rural counties. These localized experiences shape voter assessments of economic management and policy priorities.
Unemployment rates, wage growth, and cost of living consistently rank among top voter concerns. When voters perceive economic conditions as improving, incumbents benefit regardless of party. Conversely, dissatisfaction with economic trajectory creates opportunities for challengers to gain traction with persuadable voters.
National economic conditions matter for federal races, while state-specific indicators prove more relevant for gubernatorial and state legislative contests. Voters often assign credit and blame differently across levels of government, enabling ticket-splitting when they distinguish between federal and state responsibilities.
Issue Prioritization
Polling consistently shows North Carolina voters prioritizing education funding, healthcare access, infrastructure investment, and public safety. The relative salience of these issues shifts with news cycles and campaign emphasis. Candidates who successfully define the election around favorable issues gain significant advantages in persuasion.
Education policy particularly drives suburban voters, with school funding, teacher pay, and curriculum debates generating intense engagement. Parents of school-age children demonstrate heightened sensitivity to these issues and base candidate evaluations heavily on education platforms. Geographic variations in school district quality and funding create different educational political environments across counties.
Environmental issues including coastal resilience and inland flooding have gained salience following recent severe weather events. Candidates proposing concrete solutions to climate adaptation and infrastructure hardening can appeal to voters across partisan lines, particularly in affected communities. This issue demonstrates how state-specific concerns can trump national partisan messaging.
Turnout Models and Mobilization
The composition of the electorate matters as much as voter preferences. North carolina election predictions require sophisticated turnout models that account for differential participation across demographic groups, geographic areas, and partisan identities. Midterm elections typically draw 20-30% lower turnout than presidential cycles, but which voters drop off determines outcomes.
Historical Turnout Patterns
Analysis of the North Carolina State Board of Elections data reveals consistent patterns in voter participation across election types. Presidential elections generate roughly 68-72% turnout among registered voters, while midterms produce 48-54% participation. The composition of the midterm electorate skews older, whiter, and more partisan compared to presidential years.
Dropoff rates vary significantly across demographic categories:
- Voters under 30: 35-40% dropoff from presidential to midterm
- Voters 65+: 15-20% dropoff
- Unaffiliated voters: 30-35% dropoff
- Strong partisans: 18-22% dropoff
These differential participation rates mean the 2026 electorate will look substantially different from 2024 demographically and politically. Models must account for these compositional effects when translating polling to vote share predictions.
Ground Game and Voter Contact
Field operations and voter contact programs significantly influence turnout, particularly among irregular voters who participate in presidential elections but often skip midterms. Both parties invest heavily in canvassing operations, phone banking, and digital mobilization targeting their respective bases and persuadable voters.
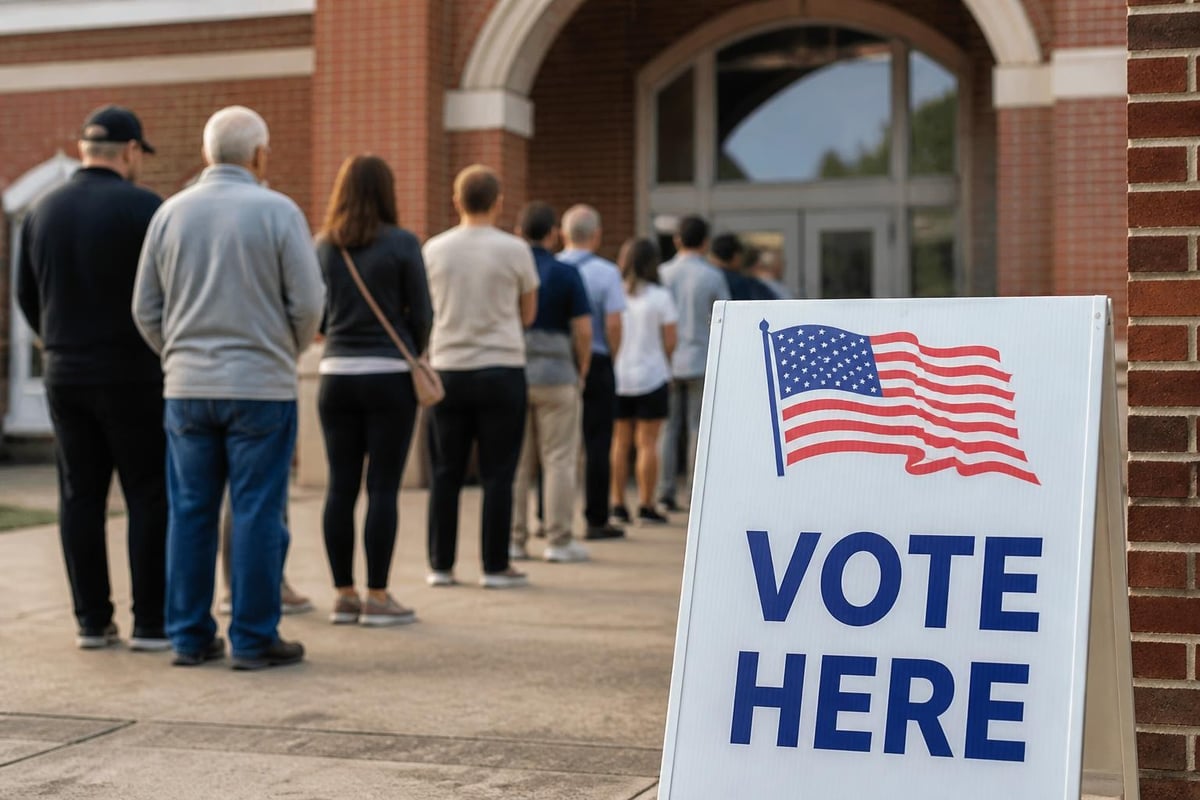
Early voting participation provides important real-time signals about turnout patterns and demographic composition. North Carolina's extensive early voting period generates substantial pre-election day participation, allowing campaigns to track whether their mobilization efforts succeed. Analysis of early vote demographics enables forecast updates as actual voting begins.
For readers seeking broader context on how presidential dynamics affect down-ballot races, understanding the interaction between presidential approval and midterm turnout proves essential. The party controlling the presidency typically faces enthusiasm gaps in midterm elections, with their voters less motivated to participate than opposition voters energized by dissatisfaction.
Polling Analysis and Current State of the Race
As of September 2026, north carolina election predictions based on available polling show highly competitive races with most statewide contests within the margin of error. Poll aggregation reveals slight advantages for different candidates across races, but historical polling error and potential late movement create substantial uncertainty.
Senate Race Polling Trends
Recent surveys in the Senate contest show a remarkably stable race with the candidates separated by 1-3 percentage points in most polls. The race has maintained this narrow margin through much of 2026 despite changing national political conditions. This stability suggests both candidates have established relatively fixed coalitions with only a small segment of truly persuadable voters remaining.
Favorability ratings for both candidates hover in the mid-40s positive and low-40s negative-neither particularly strong nor weak. These mediocre favorability profiles indicate room for late campaign movement based on debate performance, advertising effectiveness, or external events. Undecided voters comprise roughly 5-7% of the electorate in recent surveys.
Crosstabs reveal the familiar partisan and demographic patterns, with each candidate performing strongly within their expected coalition. The candidate who succeeds in maximizing turnout among their base while winning independents by even a modest margin will likely prevail. Geographic targeting in the final weeks will focus on the Charlotte and Raleigh media markets where persuadable voters concentrate.
Gubernatorial Polling Landscape
The gubernatorial race shows somewhat more volatility than the Senate contest, with the margin shifting between tied and a 4-5 point lead depending on the survey and timing. This additional uncertainty reflects the race's greater emphasis on state-specific issues and candidate characteristics rather than national partisan alignment.
| Poll Date | Candidate A | Candidate B | Undecided | MoE |
|---|---|---|---|---|
| Sept 18-20 | 47% | 43% | 10% | ±3.5% |
| Sept 11-15 | 45% | 45% | 10% | ±3.2% |
| Sept 4-8 | 46% | 44% | 10% | ±3.8% |
| Aug 28-31 | 44% | 46% | 10% | ±4.1% |
The elevated undecided share reflects voters still learning about candidates' positions on state issues. Television advertising has not yet reached saturation levels, and many voters remain open to persuasion. The candidate who more effectively communicates concrete plans for education, infrastructure, and economic development will likely consolidate support among these remaining persuadables.
National Environment and North Carolina Implications
North carolina election predictions cannot ignore national political currents that shape the environment for all down-ballot races. Presidential approval ratings, congressional job approval, and generic ballot polling provide important context for understanding likely outcomes in competitive races.
Presidential Approval and Midterm Dynamics
Historical patterns show the president's party typically loses seats in midterm elections, with losses correlated to presidential approval ratings. When approval falls below 45%, the opposition party generally gains significant seats. Approval ratings in the mid-to-high 40s create more modest losses, while approval above 50% can enable the president's party to minimize damage or occasionally gain seats.
Current presidential approval in North Carolina closely tracks national figures but typically runs slightly more Republican than the national average. This partisan lean means Democratic candidates in North Carolina face steeper challenges than their counterparts in more Democratic-leaning states during difficult national environments. Conversely, Republican candidates must work to maintain enthusiasm when national conditions favor Democrats.
Generic congressional ballot polling provides another useful indicator of the national environment. When generic ballot preferences diverge significantly from normal partisan baselines, it signals enthusiasm gaps or persuasion advantages that manifest across multiple races. North Carolina's competitive districts serve as important battlegrounds in the fight for House control.
Issue Ownership and National Narratives
Which party voters trust to handle priority issues significantly influences election outcomes. Traditionally, Republicans hold advantages on taxes, crime, and immigration, while Democrats lead on healthcare, education, and environmental protection. The relative salience of these issue sets-which topics dominate news coverage and voter attention-creates favorable or unfavorable terrain for each party.
North carolina election predictions must account for how national issue debates intersect with state-specific priorities. A national focus on economic issues when voters perceive economic problems benefits opposition candidates, while emphasis on stability and continuity favors incumbents during good economic times. Campaign messaging seeks to elevate favorable issue terrain while minimizing opponent strengths.
For additional context on how recent presidential policy debates shape voter perceptions and issue salience, understanding the connection between federal actions and state-level electoral consequences proves valuable. State candidates must navigate national party positions while sometimes distancing themselves from unpopular federal policies or leaders.
The Path to Victory for Each Party
Understanding north carolina election predictions requires analyzing what each party needs to accomplish for electoral success. Different coalitions, geographic targets, and turnout operations define distinct pathways to winning competitive races.
Democratic Strategy and Targets
Democrats must maximize turnout in Wake, Durham, and Mecklenburg counties while remaining competitive in suburban ring counties surrounding these urban cores. The party's coalition depends on strong support from African American voters, young professionals, and college-educated women. Underperformance with any of these groups jeopardizes statewide viability.
Persuasion targets include moderate suburban voters concerned about education funding, healthcare access, and environmental protection. These voters often split tickets and prove receptive to candidate-specific appeals rather than pure partisan messaging. Democrats emphasize competence, local connections, and concrete policy solutions when courting these persuadables.
Geographic targeting focuses on:
- Maximizing urban turnout and vote share in reliable Democratic strongholds
- Winning suburban swing counties by modest margins through persuasion and mobilization
- Minimizing losses in rural counties by holding ancestral Democrats and appealing to economic populism
The party's field operation emphasizes early voting mobilization, targeting voters with histories of sporadic participation who require personal contact to turn out. Digital advertising supplements traditional voter contact with precisely targeted messages to specific demographic and geographic segments.
Republican Strategy and Targets
Republicans must run up large margins in rural counties while remaining competitive in suburban areas experiencing demographic change. The party's coalition relies on strong performance among white voters without college degrees, older voters, and evangelical Christians. Maintaining enthusiasm among these core supporters while adding persuadable suburbanites defines the strategic challenge.
Persuasion efforts target security-conscious suburban voters concerned about crime, inflation, and cultural issues. Republicans emphasize traditional values, fiscal responsibility, and individual liberty when appealing to these audiences. The party must walk a careful line-energizing the base without alienating moderate suburbanites.
Geographic priorities include:
- Maximizing turnout in small towns and rural counties across the Piedmont and Mountains
- Winning outer-suburban counties in the Charlotte and Raleigh metro areas
- Limiting Democratic margins in urban cores through targeted minority outreach
Republican field operations increasingly emphasize community-based organizing and relational voter contact rather than traditional door-to-door canvassing. The party invests heavily in absentee and early vote programs to match Democratic advantages in these areas.
North carolina election predictions for 2026 reveal a highly competitive political environment where demographic trends, turnout operations, and national political currents intersect to create uncertain outcomes in key races. Success requires sophisticated understanding of local dynamics, rigorous data analysis, and effective campaign execution across diverse constituencies. For comprehensive, non-partisan coverage of how presidential politics and federal policy shape state electoral dynamics, U.S. Presidential Report delivers expert analysis and timely updates throughout the election cycle, helping readers understand the complex factors driving American political competition.