The senate projections 2026 vs 2024 midterms comparison comes down to one point: the 2026 map is far more favorable to Democrats than the 2024 map was, yet control still depends on a handful of races decided by narrow margins. In 2024, Democrats defended a heavy load of seats in red and purple states. In 2026, Republicans hold the larger share of contested seats, and forecasters have rated the chamber as a near coin flip with a slight Democratic lean. Note that "2024 midterms" is a common shorthand, since 2024 was a presidential cycle and the midterms are held in 2026, so this comparison sets the 2026 forecasts against the 2024 Senate results and projections that preceded them.
How the 2026 Senate Map Differs From the 2024 Map
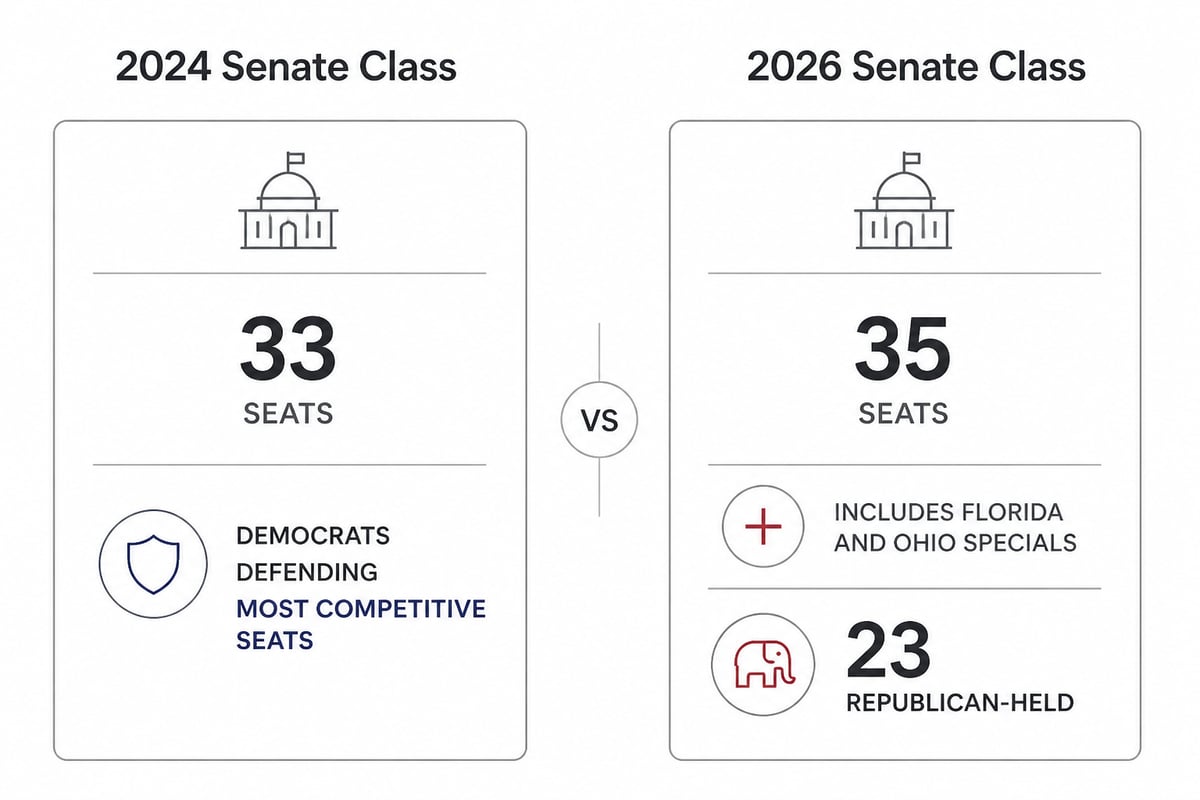
The 2026 Senate map puts more Republican seats at risk, while the 2024 map put more Democratic seats at risk. According to 270toWin, 35 seats are up in 2026, including special elections in Florida and Ohio, and 23 of those seats are Republican-held.
That split reverses the pressure Democrats faced two years earlier. In 2024, Democrats defended a heavy load of seats in red and purple states, where the presidential environment leaned against them. Class 1 seats, the group up in 2024, were last contested in 2018, which left the party exposed. Class 2 seats, the group up in 2026, were last decided in 2020, and the Republicans who hold them now face a different national mood.
Three structural differences stand out:
- Seat count: 35 seats are contested in 2026, including the two specials.
- Party exposure: Democrats carried the larger defensive burden in 2024; Republicans carry it in 2026.
- Presidential effect: 2024 was a presidential year with high turnout, while 2026 is a midterm, when the president's party has historically lost ground.
For a wider look at how control is shaping up, see our 2026 Senate control forecast compared with 2024 results.
What Democrats Need in 2026 Compared With 2024
Democrats need a net gain of four seats to retake Senate control in 2027, a harder lift than simply holding the line but a more realistic one than the position they occupied heading into 2024. 270toWin states the four-seat threshold directly.
In 2024, the question was different. Democrats entered the cycle defending a majority on a map that offered Republicans several plausible targets, so the realistic Republican path required flipping a limited number of seats.
The 2026 math reverses the burden of proof. Republicans hold most of the contested seats, and a net Democratic gain of four would end their control. That is a meaningful change in how analysts frame the race. Where 2024 coverage asked how many Democratic seats might fall, 2026 coverage asks how many Republican seats are vulnerable enough to tip the chamber.
Forecaster Ratings: Where the Projections Stand
Final 2026 ratings from the major nonpartisan forecasters place the Senate close to even, with a modest edge for Democrats. In its closing ratings, Sabato’s Crystal Ball classified 53 seats as at least Leans Democratic and 47 as at least Leans Republican.
The Cook Political Report's final analysis was more cautious about certainty. On October 30, 2026, Cook’s closing analysis said seven key Senate races were within the margin of error and described Democrats as slight favorites. That wording matters. A slight favorite in a field of toss-ups is not a safe projection, and it reflects how much of the outcome rests on a few contests.
For readers who want a plain-language view of the competitive map and the rating categories, NPR’s guide to the 2026 Senate map outlines the races and explains how many seats each party needs.
Side-by-Side: 2024 and 2026 at a Glance
The table below summarizes the core differences between the two cycles using the figures confirmed above and the structural context of each class.
| Factor | 2024 Senate Cycle | 2026 Senate Cycle |
|---|---|---|
| Election type | Presidential year | Midterm |
| Seats on the ballot | Regular Class 1 seats | 35 seats, including Florida and Ohio specials |
| Party with more seats at risk | Democrats | Republicans (23 of 35 seats) |
| Net change needed for Democratic control | Defensive hold | Net gain of four seats |
| Final forecaster posture | Republican-leaning map | Slight Democratic lean, seven races within the margin of error |
The pattern is consistent. The 2024 environment rewarded the party playing offense on a favorable map, and the 2026 environment points the opposite direction.
How the Senate Projections 2026 vs 2024 Midterms Comparison Shifts by Region
Regional strength is one of the clearest differences between the two cycles, because the states in play have changed. In 2024, many of the most competitive Senate contests ran through the industrial Midwest and the Mountain West. Candidates in those states were measured against a presidential ticket that shaped turnout up and down the ballot, a dynamic we covered in our look at electric vehicle policy in the Michigan Senate race.
In 2026, the Republicans defending seats in the Sun Belt and the South face a field that differs from earlier cycles. The addition of special elections in Florida and Ohio widens the field further, since those seats carry their own candidate dynamics and shorter timelines. Forecasters treat these states with caution, because a seat rated Leans Republican can move quickly if the national mood shifts.
The practical lesson for readers tracking projections is to watch the specials separately from the regular seats. A special election can behave differently from a regular contest because the incumbent profile, filing deadlines and candidate quality differ.

The Midterm Penalty and Presidential Approval
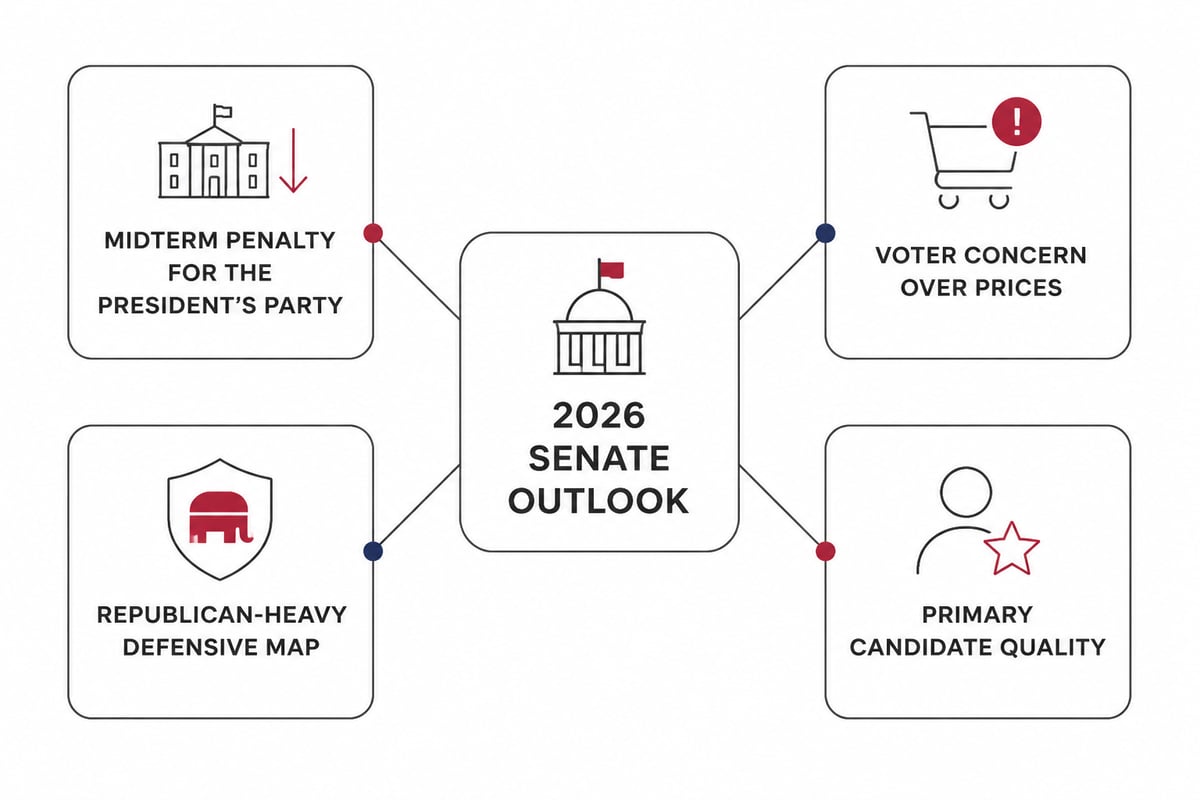
Midterm elections have often cost the president's party seats, and that pattern is one force behind the 2026 Democratic lean. In presidential years like 2024, the top of the ticket pulls voters to the polls and tends to align Senate results with the presidential outcome. In midterms, that pull disappears, and voters often use the ballot to register approval or disapproval of the sitting president.
Several issues shape that judgment this year. Prices and household costs remain central, which we examine in our report on inflation and the 2026 midterms. Immigration, spending and federal restructuring also draw attention, and the broader list of voter concerns is laid out in our review of the top political issues Americans care about in 2026.
Primary dynamics matter as well. Candidate selection in contested Republican primaries can affect general election strength, a theme we explored in coverage of Trump-endorsed candidates and the 2026 midterms. A nominee who wins a primary by a wide margin does not always perform as well with independents in November.
Margin of Error: Why Polling Context Differs
Polling precision is the biggest caveat on any projection, and it applies differently in 2026 than in 2024. When Cook reports that seven key Senate races sit inside the margin of error, it means the polling average cannot separate the candidates with confidence. In those contests, a two-point miss in either direction changes who wins.
Polling error also tends to run in one direction across many states at once. If surveys understate one party's support in a region, several races shift together rather than independently. That correlation is why a slight favorite in a single race can still fail to produce a majority, and why forecasters stress ranges over single numbers.
Readers can apply a simple discipline to any projection they encounter:
- Check whether the rating is Lean, Likely or Solid, since each carries a different level of confidence.
- Look at how many races sit within the margin of error rather than at the headline seat count.
- Compare multiple forecasters instead of relying on one rating.
- Treat a rating change in the final two weeks as meaningful, since late movement often signals real shifts in turnout or candidate quality.
Our report on swing-state polling in 2026 goes deeper on how to read these averages.
Turnout Differences Between a Presidential Year and a Midterm
Turnout is the quiet variable that separates the 2024 and 2026 projections. A presidential election draws a broader and less partisan electorate, while a midterm electorate is older, more engaged and more reflective of each party's committed base. That shift changes which candidates benefit.
Two features of the midterm electorate matter for the Senate:
- Base enthusiasm: The party out of the White House often turns out at higher rates, which supports the Democratic lean in 2026.
- Independent behavior: Independents who split tickets in 2024 may choose differently when no presidential race anchors their decision.
For a closer look at how party turnout has trended, see our analysis of Democratic and Republican voter turnout trends. The movement of unaffiliated voters is covered in our piece on independent voter shift trends.
What the 2026 Result Would Mean for the Presidency
Control of the Senate shapes what a president can accomplish in the second half of a term, which is why these projections draw attention beyond the chamber itself. The Senate confirms judges and cabinet officials, approves treaties, and holds the 60-vote filibuster threshold that governs most legislation.
If Democrats gain the four seats they need, the White House would face a Congress able to slow nominations, scrutinize executive actions and block legislative priorities. That outcome would sharpen debate over executive authority, a subject we examined when comparing executive powers in 2026 and 2024. If Republicans hold the chamber, the president retains a clearer path for confirmations and for the agenda items that depend on Senate votes.
The legislative stakes are concrete. Spending levels, border funding and tax policy all pass through the Senate, and our reporting on government spending in 2026 shows how much of the federal budget depends on who holds a working majority.
A Practical Reading of the Comparison
The most reliable way to read the 2026 outlook is as a map shift rather than a prediction of a wave. The 2024 cycle favored Republicans because of where the seats were. The 2026 cycle favors Democrats modestly because of where the seats are now, and because midterm conditions tend to move against the party holding the White House.
Three points are worth carrying forward:
- A D+6 rating from Sabato's Crystal Ball and a slight-favorite label from Cook describe an advantage, not a lock.
- Seven races within the margin of error mean a handful of contests will decide the majority.
- Special elections in Florida and Ohio add variance that standard class-based comparisons can obscure.
Anyone following the count on election night should track the toss-up states first, then the Leans categories, and only then the broader totals.
For your next step, pick the three or four toss-up Senate races you want to follow and check their ratings against more than one forecaster each week through Election Day. U.S. Presidential Report publishes non-partisan coverage of presidential elections, Congress and federal policy, so you can follow the Senate picture alongside the stories shaping it. If you want to discuss these races with neighbors and fellow readers, U.S. Presidential Report is a good place to start the conversation, and you can Start Your Own Political Club around the coverage you find most useful.