Election polls have become a constant presence in American political discourse, particularly during presidential races. Yet many Americans misunderstand the mechanics behind these surveys and the reasons they sometimes fail to predict outcomes accurately. Understanding how election polls work requires examining the science of sampling, the challenges of reaching representative voters, and the statistical methods pollsters use to transform raw responses into meaningful predictions. This knowledge is essential for anyone following presidential elections and interpreting the flood of polling data that shapes campaign strategies and media narratives.
The Foundation: Random Sampling and Probability
At its core, how election polls work depends on a mathematical principle: a relatively small, randomly selected group can represent the opinions of a much larger population. This concept, known as probability sampling, relies on every member of the target population having a known, non-zero chance of selection.
Why Sample Size Matters Less Than You Think
Most national election polls survey between 800 and 1,500 registered or likely voters. Many people assume larger samples always produce better results, but this isn't necessarily true. A properly randomized sample of 1,000 voters can accurately represent 150 million voters with a predictable margin of error.
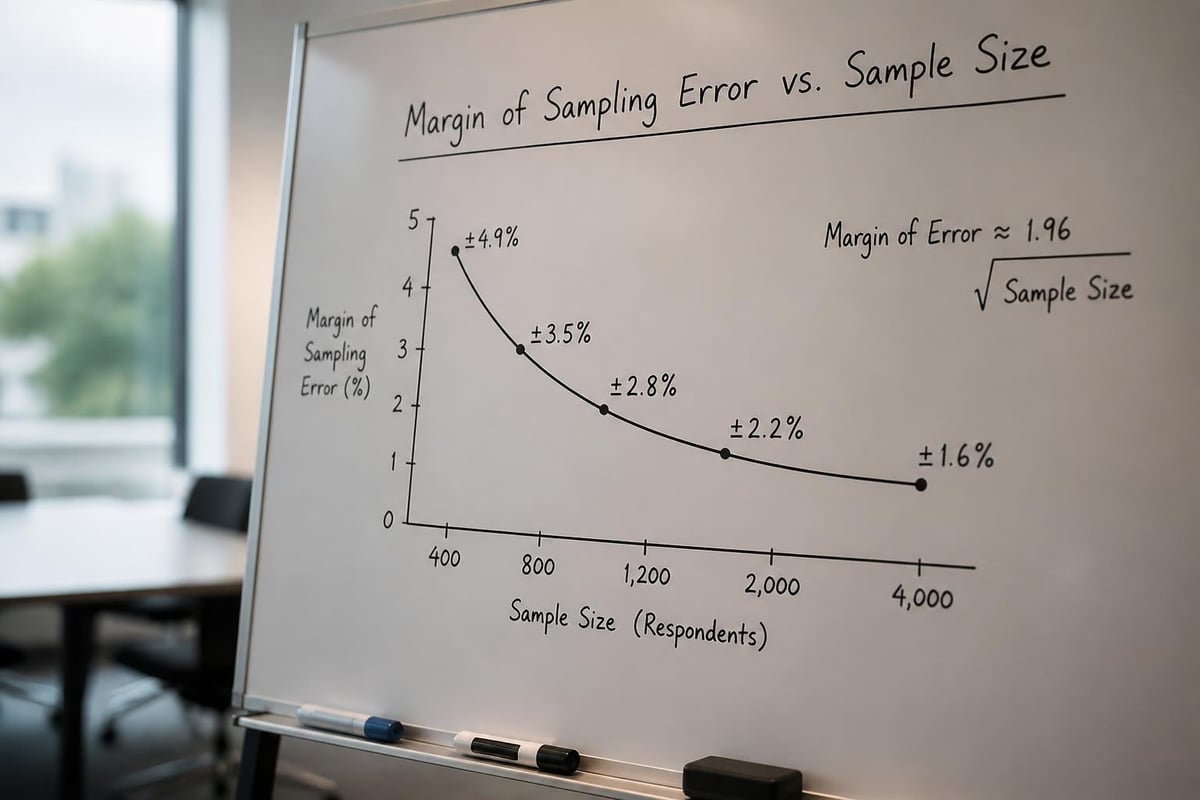
The margin of sampling error for a typical poll of 1,000 respondents is approximately plus or minus 3 percentage points at a 95% confidence level. This means if a poll shows a candidate at 48% support, the true figure likely falls between 45% and 51%. The American Association for Public Opinion Research explains that this margin only accounts for random sampling error, not the numerous other sources of potential error.
The relationship between sample size and precision follows a mathematical law of diminishing returns:
| Sample Size | Margin of Error (±) |
|---|---|
| 400 | 4.9% |
| 1,000 | 3.1% |
| 1,500 | 2.5% |
| 2,000 | 2.2% |
| 4,000 | 1.5% |
Doubling the sample from 1,000 to 2,000 only reduces the margin by 0.9 percentage points, which explains why most pollsters stop around 1,000-1,500 respondents.
How Pollsters Reach Voters
Understanding how election polls work requires examining the evolving methods pollsters use to contact respondents. The techniques have changed dramatically over the past two decades as telephone response rates have plummeted and internet access has become nearly universal.
Traditional Random-Digit Dialing
For decades, the gold standard was random-digit dialing (RDD) of landline telephones. Pollsters would generate random phone numbers, ensuring every household had an equal chance of selection. This method worked well when landline penetration exceeded 95% of households and response rates hovered around 30-40%.
By 2026, landline-only households represent less than 5% of the population, and response rates for telephone surveys have fallen below 6%. Pew Research Center’s methodology reports document this dramatic shift in the polling landscape.
Modern Multi-Mode Approaches
Today's pollsters typically combine multiple contact methods:
- Cell phone RDD: Calling both landlines and cell phones to reach the 95%+ of adults who have mobile phones
- Online panels: Using pre-recruited panels of respondents who have agreed to take surveys
- SMS-to-web: Sending text messages with survey links to randomly generated cell phone numbers
- Address-based sampling: Mailing survey invitations to randomly selected households
- Interactive voice response (IVR): Automated phone surveys with keypad or voice responses
Each mode introduces different challenges and potential biases. Phone surveys tend to reach older, more politically engaged respondents. Online surveys may oversample younger, more tech-savvy voters. The best pollsters carefully weight responses to compensate for these differences.
The Art and Science of Weighting
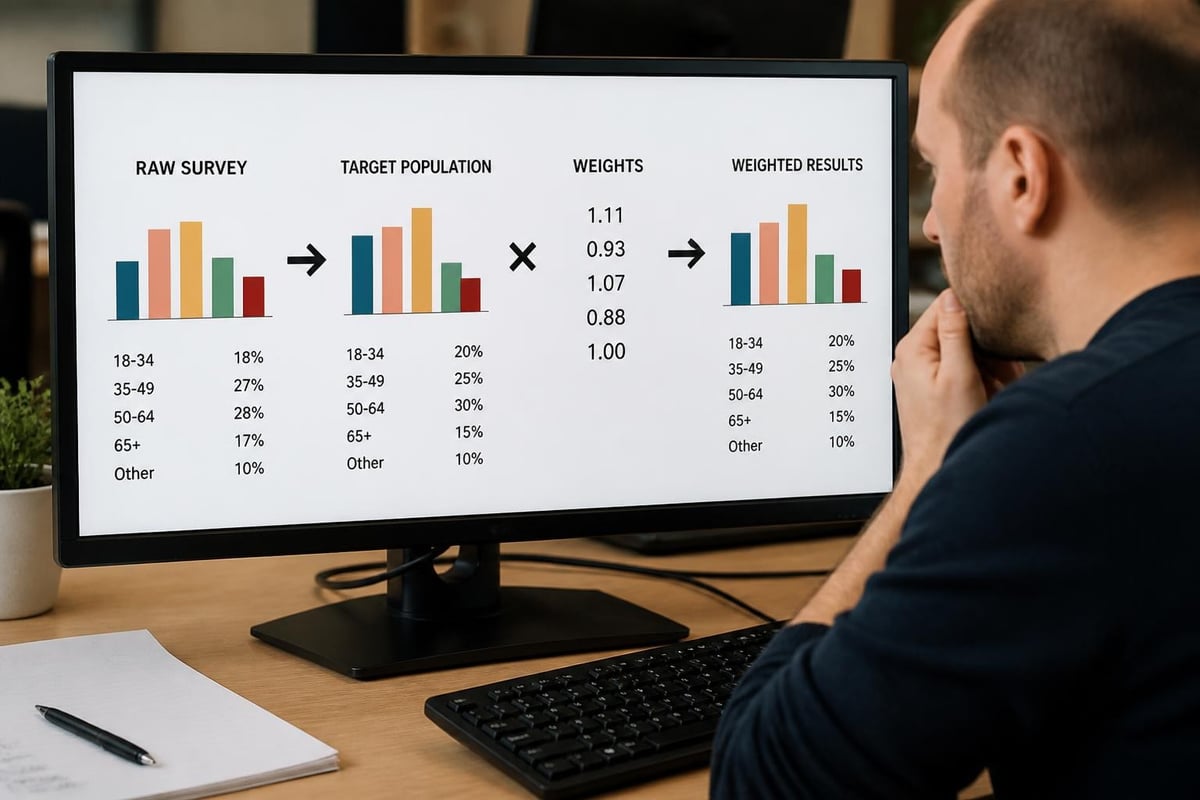
Raw survey responses never perfectly mirror the population. Perhaps your poll reached too many college graduates or too few Hispanic voters. This is where weighting becomes crucial to how election polls work in practice.
Demographic Weighting
Pollsters assign weights to each respondent based on how common their demographic profile is in the target population. If your survey of 1,000 voters includes 200 Hispanic respondents but Census data shows they should be 150 in a representative sample, each Hispanic response gets weighted down slightly.
Common weighting variables include:
- Age groups (18-29, 30-44, 45-64, 65+)
- Gender
- Race and ethnicity
- Education level
- Geographic region
- Population density (urban, suburban, rural)
Pew Research Center’s approach to weighting includes additional political variables to improve accuracy. Some pollsters weight by party identification, though this remains controversial since partisanship can shift between elections.
Past Vote Weighting
An increasingly common practice is weighting by how respondents say they voted in the previous presidential election. If your poll captures too many people claiming they voted for the winner, their responses get down-weighted to match actual election results.
This technique assumes:
- People accurately remember and report their past votes (they often don't)
- The composition of the electorate remains similar between elections (it frequently changes)
- Past vote predicts current preferences better than demographics alone (evidence is mixed)
Likely Voter Screens: The Critical Filter
Perhaps the most challenging aspect of how election polls work involves determining who will actually vote. A poll of all adults differs dramatically from a poll of likely voters in a presidential election.
Methods for Identifying Likely Voters
Pollsters use various screening techniques:
Simple screens ask one or two questions:
- Are you registered to vote?
- How likely are you to vote: absolutely certain, very likely, somewhat likely, or not at all?
Complex models combine multiple factors:
- Voting history from voter files
- Self-reported past voting frequency
- Current interest in the election
- Knowledge of polling location
- Attention to campaign news
The FiveThirtyEight polling methodology adjusts for whether polls use registered voter or likely voter screens, since likely voter polls typically show different results, especially far from Election Day.
Different screens can produce dramatically different results. In a hypothetical poll, the registered voter result might show Candidate A at 49% and Candidate B at 47%, while the likely voter model shows 51% to 45%. The pollster must decide which number to report.
Question Wording and Order Effects
The specific words pollsters choose and the sequence of questions significantly impact results. This is why understanding how election polls work requires examining the full questionnaire, not just the headline numbers.
The Presidential Ballot Question
Most pollsters ask some variation of: "If the election for president were held today, would you vote for [Candidate A] the [Party] or [Candidate B] the [Party]?"
Subtle variations matter:
- Mentioning party labels tends to increase partisan loyalty
- Randomizing candidate order prevents primacy effects (people slightly favor the first option)
- Including third-party candidates reduces major-party vote shares
- Offering "undecided" as an explicit option typically increases undecided responses
Question order also matters. Asking about job approval before vote choice can influence responses if voters seek consistency between their answers. Professional pollsters rotate question order to minimize these effects.
Sources of Polling Error Beyond Sampling
The margin of sampling error represents only one source of uncertainty. Research on total survey error demonstrates that non-sampling errors often exceed random sampling variability.
Coverage Error
Coverage error occurs when some members of the population have zero chance of being selected. If your sampling frame excludes certain groups, no amount of weighting can fully compensate.
Examples include:
- Cell-phone-only surveys missing the 2% without mobile phones
- Online panels excluding those without internet access
- English-language surveys missing non-English speakers
Nonresponse Error
When response rates sit below 10%, the concern isn't the sample size but whether respondents differ systematically from non-respondents. If supporters of one candidate are more willing to answer surveys, polls will show bias no matter how large the sample.
The 2024 AAPOR Task Force report examined whether differential nonresponse by party explained recent polling misses. Their findings suggest weighting adjustments have improved but haven't fully solved the problem.
| Error Type | Typical Magnitude | Can Weighting Fix? |
|---|---|---|
| Sampling error | ±3 points | N/A (random) |
| Coverage error | 1-3 points | Partially |
| Nonresponse error | 2-5 points | Partially |
| Measurement error | 1-4 points | Rarely |
Measurement Error
People sometimes give inaccurate answers due to:
- Social desirability bias (saying what sounds "good" rather than the truth)
- Question misunderstanding
- Lack of knowledge but unwillingness to admit it
- Satisficing (giving quick, thoughtless answers to finish the survey)
Some voters tell pollsters they're undecided when they've actually decided but don't want to admit their choice.
Poll Aggregation and Forecasting Models
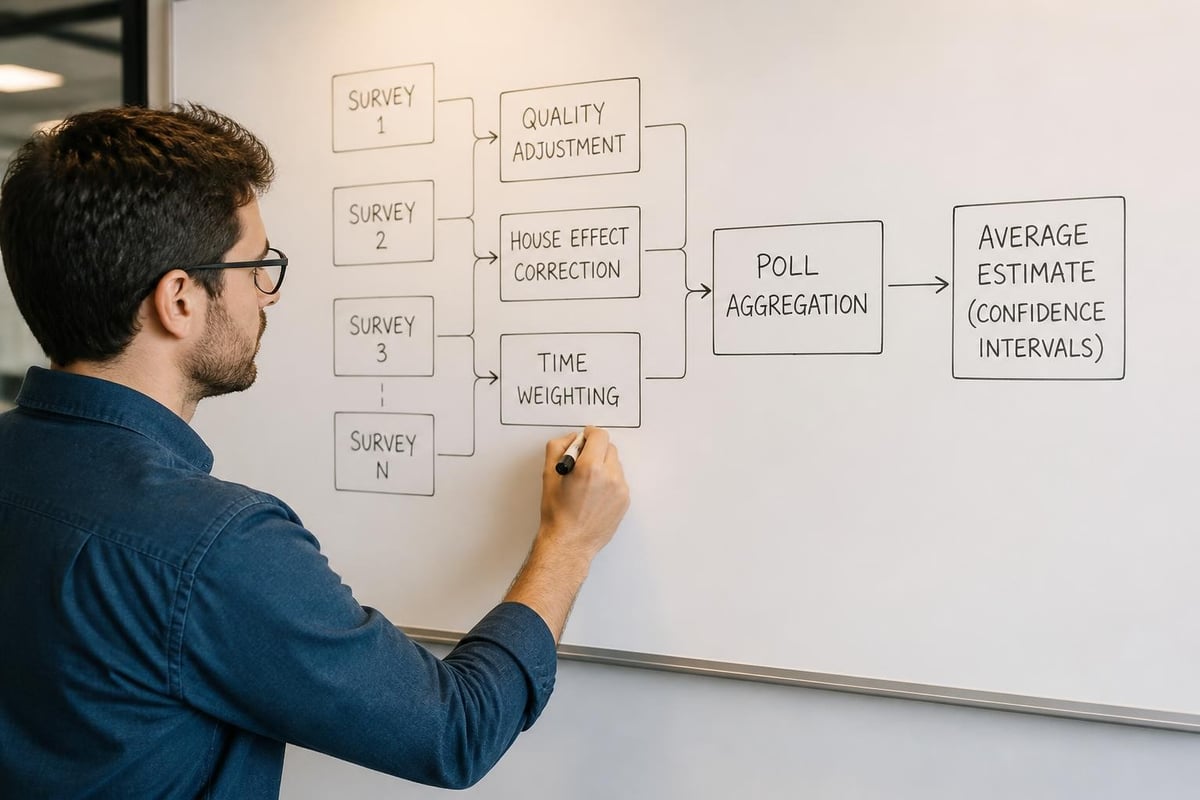
Individual polls provide snapshots with significant uncertainty. Poll aggregators combine multiple surveys to reduce noise and provide more stable estimates of the race. This represents an advanced application of how election polls work together.
How Aggregators Weight Polls
Rather than simple averaging, sophisticated aggregators like FiveThirtyEight apply weights based on:
- Recency: Recent polls receive more weight than older ones
- Sample size: Larger samples receive moderately more weight
- Pollster quality: Track records matter; accurate pollsters get higher weight
- Methodology: Probability samples weighted higher than opt-in panels
- House effects: Adjustments for pollsters who consistently lean toward one party
The goal isn't to find the single "best" poll but to extract signal from the collective noise of many imperfect measurements.
Beyond Simple Averages
Election forecasting models go further by:
- Incorporating fundamental factors like economic conditions and presidential approval
- Accounting for uncertainty that increases the further from Election Day
- Modeling correlations between states (if a candidate overperforms polls in one Midwestern state, they likely will in similar states)
- Simulating thousands of scenarios to estimate probability ranges
These models can show a candidate at 48% in the polls but with a 65% chance of winning, because narrow leads in key states translate to Electoral College victory.
Why Polls Sometimes Miss
Recent presidential elections have exposed limitations in how election polls work, with notable misses in 2016 and 2020. Several factors contributed:
Differential Nonresponse by Party
Evidence suggests supporters of certain candidates, particularly former President Trump, have been less likely to respond to surveys. This creates systematic bias even after demographic weighting.
Pollsters have responded by:
- Weighting by past vote and partisanship
- Using multiple contact modes
- Adjusting for education, which correlates with survey response
- Conducting longer field periods to reach hard-to-contact voters
Late-Deciding Voters
When significant numbers of voters make up their minds in the final days, polls can accurately capture sentiment at the time but miss the eventual outcome. Exit polls and post-election analysis help identify when this occurs.
Polling in Primary Elections
Presidential primaries present unique challenges. The likely voter universe is smaller and harder to identify, name recognition changes rapidly, and voters have less-formed preferences. This is why primary polls often show wider variance and lower accuracy than general election polls.
Industry Standards and Transparency
Reputable pollsters adhere to disclosure standards that help consumers evaluate poll quality. The British Polling Council’s transparency rules provide a model that many American organizations follow.
Essential disclosures include:
- Sample size and margin of error
- Population sampled (adults, registered voters, likely voters)
- Sampling method (RDD, online panel, etc.)
- Field dates
- Weighting variables
- Question wording
- Sponsor and conducting organization
When polls lack these details, skepticism is warranted. The MIT Election Data + Science Lab maintains archives of polling data and methodology for researchers studying accuracy and methods.
The Evolution of Polling Methods
As traditional methods have become less effective, pollsters have experimented with alternatives. Gallup’s approach to opt-in sampling illustrates how even legacy organizations are adapting.
Non-Probability Sampling
Some firms now use non-probability methods where respondents self-select into panels rather than being randomly chosen. These "opt-in" surveys recruit through:
- Online advertising
- Social media
- Website intercepts
- Rewards programs
Critics argue these samples suffer from selection bias. Proponents counter that sophisticated weighting and statistical modeling can produce results comparable to probability samples at lower cost. Research validating these methods shows mixed results, with some firms performing well and others producing significant errors.
Blended Approaches
The future of how election polls work likely involves combining multiple methods. A pollster might:
- Start with a probability sample via cell phone and address-based methods
- Supplement with online panel respondents matched to demographic targets
- Apply advanced weighting including political variables
- Validate against voter file data where available
This hybrid approach attempts to balance scientific rigor with practical constraints of declining response rates and rising costs.
Reading Polls as an Informed Consumer
For readers following presidential news and elections, critical evaluation of polls requires asking key questions:
About the methodology:
- Who sponsored and conducted the poll?
- What was the sample size and margin of error?
- How were respondents selected and contacted?
- What weighting was applied?
About the results:
- Is this registered voters or likely voters?
- When was the survey conducted?
- What was the exact question wording?
- How do results compare to other recent polls?
About the interpretation:
- Is the reported difference larger than the margin of error?
- Are we comparing apples to apples (same population and methodology)?
- How does the pollster's track record look?
- What does the poll aggregation show?
A single poll showing a surprising result deserves attention but not overreaction. Patterns across multiple quality polls carry much more information.
The Impact on Presidential Campaigns
Understanding how election polls work helps explain why campaigns invest heavily in both public and private polling. Public polls shape:
- Media narratives about who is winning and losing
- Donor enthusiasm and fundraising success
- Volunteer energy and ground game effectiveness
- Strategic decisions about where to campaign and advertise
Private campaign polls typically use longer questionnaires to test message effectiveness, identify persuadable voters, and refine targeting. These surveys inform economic messaging, foreign policy positioning, and attack strategies.
Campaigns also conduct benchmark polls early in the race, tracking polls throughout, and brushfire polls to respond to sudden events. The polling operation is now central to modern presidential campaigns.
Election polling remains an imperfect but essential tool for understanding public opinion in presidential races. While polls have limitations and occasionally miss the mark, they provide valuable insights when interpreted carefully with full knowledge of their methodology and uncertainty. For comprehensive, non-partisan coverage of presidential elections and the political landscape that shapes them, U.S. Presidential Report delivers the context you need to make sense of both the polls and the races they measure.