Evaluating the best economy under recent presidents requires examining multiple economic indicators across different administrations. From Bill Clinton's tenure in the 1990s through Joe Biden's current presidency, each administration has faced unique economic challenges and opportunities. Understanding which president presided over the strongest economy demands a careful analysis of employment data, GDP growth, wage trends, inflation rates, and fiscal policy outcomes. This comprehensive review examines the economic performance of the last six presidents to determine which administration delivered the most robust economic results for American households and businesses.
Defining Economic Success Across Presidential Terms
Measuring the best economy under recent presidents involves selecting appropriate metrics that reflect real-world prosperity. Economists typically focus on several core indicators when assessing economic performance.
Gross Domestic Product (GDP) growth represents the total value of goods and services produced and serves as the broadest measure of economic expansion. Unemployment rates indicate labor market health and job availability for American workers. Real wage growth shows whether paychecks are keeping pace with inflation, while household income trends reveal whether families are becoming more financially secure. Inflation rates measure purchasing power and cost-of-living changes that directly impact consumers.
Key Metrics for Comparison
Different stakeholders prioritize different indicators when determining economic success:
- Business leaders focus on GDP growth and corporate profits
- Workers emphasize employment rates and wage growth
- Families prioritize household income and purchasing power
- Economists examine productivity gains and trade balances
- Policy analysts review deficit levels and debt-to-GDP ratios
The Federal Reserve Monetary Policy Report provides comprehensive analysis of how monetary policy decisions influence these economic outcomes across different administrations.

The Clinton Era: Sustained Growth and Surplus
Bill Clinton's presidency (1993-2001) is frequently cited when discussing the best economy under recent presidents. His administration coincided with exceptional economic expansion during the technology boom.
GDP growth averaged 3.9% annually during Clinton's eight years, significantly higher than most subsequent administrations. Unemployment fell from 7.3% when he took office to 4.2% by January 2001. The economy added approximately 22.7 million jobs during this period, representing robust employment growth across multiple sectors.
Perhaps most notably, the federal budget shifted from deficit to surplus during Clinton's second term. The government recorded budget surpluses from 1998 through 2001, the first such achievement since 1969. This fiscal improvement resulted from a combination of economic growth, tax policy adjustments, and spending restraint.
Income and Productivity Gains
Real median household income grew substantially during the Clinton years. According to U.S. Census Bureau data on income and poverty trends, household incomes rose across most income brackets, with particular gains in the latter half of the 1990s.
| Economic Indicator | Clinton Administration | National Average (1993-2026) |
|---|---|---|
| Average GDP Growth | 3.9% annually | 2.4% annually |
| Job Creation | 22.7 million | 15.2 million per term |
| Budget Status | Surplus (1998-2001) | Deficit (most years) |
Productivity improvements accelerated during this period as businesses adopted new technologies and streamlined operations. These gains contributed to rising wages without triggering significant inflation.
The George W. Bush Years: Expansion and Recession
George W. Bush's presidency (2001-2009) encompassed both economic growth and the severe financial crisis of 2008-2009. Evaluating the best economy under recent presidents must account for both the mid-decade expansion and the subsequent collapse.
The early Bush years featured modest recovery from the 2001 recession, followed by solid growth from 2003 to 2007. Unemployment declined to 4.4% by 2006-2007 before spiking dramatically during the financial crisis. By January 2009, unemployment had reached 7.8% and would continue rising into the Obama administration.
GDP growth averaged approximately 2.2% annually across Bush's two terms, substantially lower than Clinton's record. The Great Recession of 2008-2009 severely impacted these averages, with GDP contracting sharply in the final year of Bush's presidency.
Housing market dynamics played a central role in both the expansion and subsequent crisis. Home values rose rapidly through 2006 before collapsing, triggering widespread financial instability that affected employment, income, and wealth across all demographic groups.
Tax policy changes in 2001 and 2003 reduced federal revenue while spending increased for military operations and Medicare expansion. These factors, combined with recession-related revenue declines, produced large budget deficits throughout Bush's tenure.
The Obama Recovery: Jobs and Healthcare
Barack Obama inherited the worst economic crisis since the Great Depression. Assessing the best economy under recent presidents requires recognizing the starting conditions each administration faced.
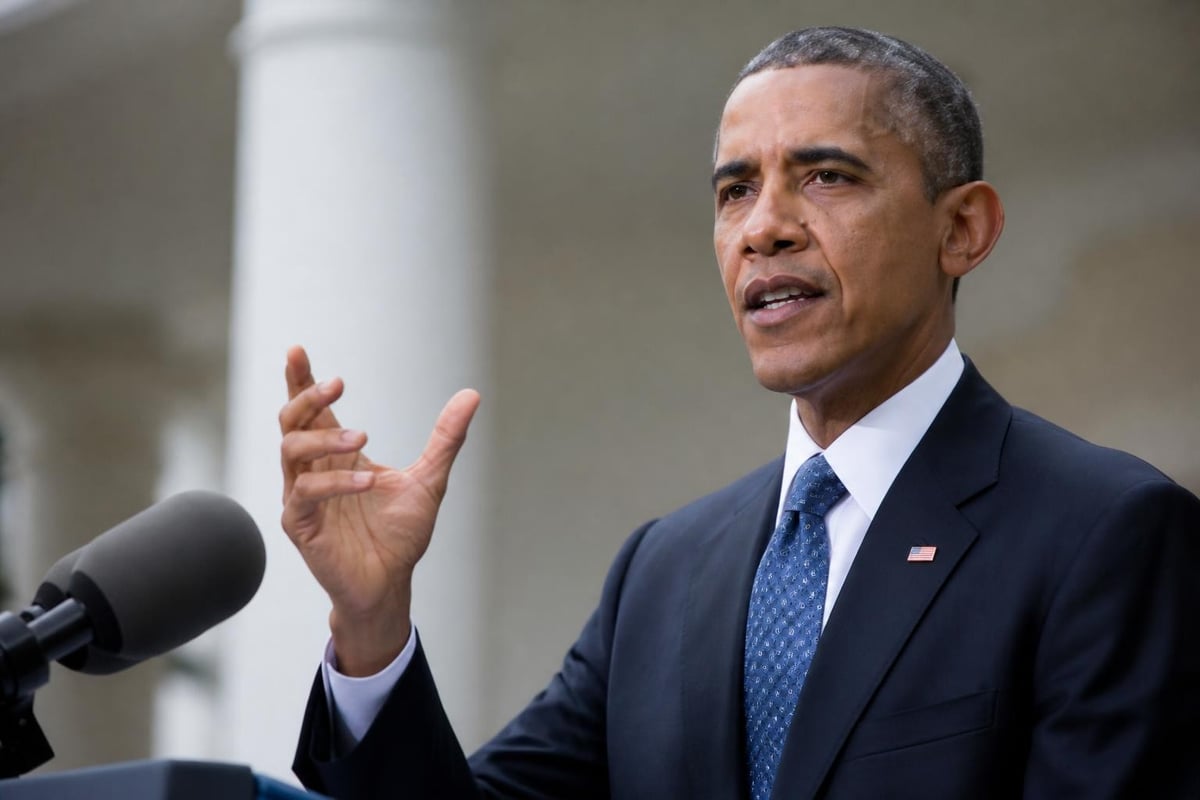
Unemployment peaked at 10% in October 2009 before beginning a long, steady decline. By January 2017, unemployment had fallen to 4.7%, representing substantial labor market recovery. The Obama administration oversaw the creation of approximately 11.6 million jobs, though this figure includes both the deep losses of 2009 and subsequent gains.
Growth and Income Patterns
GDP growth averaged 2.2% annually during Obama's presidency, matching Bush's average but disappointing relative to typical post-recession recoveries. Economists debate whether regulatory policies, global economic headwinds, or structural changes in the economy explain this moderate growth pace.
Real median household income declined during Obama's first term before recovering and eventually exceeding pre-recession levels by 2015-2016. However, income inequality widened during this period, with gains concentrated among higher earners while middle-income households experienced slower recovery.
The Affordable Care Act represented a major domestic policy initiative that expanded health insurance coverage but generated ongoing political controversy. Supporters credit it with reducing the uninsured rate, while critics cite increased premiums and regulatory burdens.
Deficit reduction emerged as a second-term achievement. The annual deficit fell from $1.4 trillion in fiscal 2009 to $585 billion in fiscal 2016, though total federal debt roughly doubled during Obama's presidency due to cumulative deficits.
Trump's Pre-Pandemic Economy: Growth and Jobs
Donald Trump's presidency (2017-2021) began with continued economic expansion before the COVID-19 pandemic disrupted all normal economic patterns. When evaluating the best economy under recent presidents, analysts typically separate Trump's first three years from 2020's pandemic year.
From 2017 through 2019, unemployment continued declining, reaching a 50-year low of 3.5% in late 2019. GDP growth accelerated slightly compared to late Obama-era performance, averaging approximately 2.5% annually during 2017-2019. Job creation remained strong, with approximately 6.7 million jobs added during Trump's first three years.
The Tax Cuts and Jobs Act of 2017 reduced corporate tax rates and modified individual tax brackets. Proponents argued this stimulated investment and growth, while critics noted increased deficits and disproportionate benefits for high earners. Brookings Institution analysis provides detailed examination of these fiscal policy choices and their long-term implications.
Wages and Trade Policy
Real wage growth improved during Trump's presidency, particularly for lower-income workers. Tight labor markets in 2018-2019 increased worker bargaining power, contributing to wage gains that outpaced inflation. This trend represented a positive shift after years of stagnant wage growth for many workers.
Trade policy changes included tariffs on Chinese goods, renegotiation of NAFTA (replaced by USMCA), and increased trade tensions globally. These policies aimed to protect American manufacturers but also increased costs for businesses and consumers who relied on imported goods.
| President | Pre-Crisis Unemployment Low | Average GDP Growth (Excluding Crisis Years) | Major Tax Policy |
|---|---|---|---|
| Clinton | 3.9% | 3.9% | 1993 tax increase |
| Bush | 4.4% | 2.8% (2003-2007) | 2001 & 2003 cuts |
| Obama | 4.7% | 2.3% | No major changes |
| Trump | 3.5% | 2.5% (2017-2019) | 2017 tax cuts |
The pandemic's arrival in early 2020 devastated the economy, causing unemployment to spike to 14.7% in April 2020 and GDP to contract sharply. Massive fiscal stimulus programs attempted to cushion the blow, but pandemic-era economic performance cannot be fairly compared to normal periods.
Biden's Economy: Recovery and Inflation Challenges
Joe Biden's presidency began amid ongoing pandemic recovery efforts and has faced unique economic challenges including supply chain disruptions and elevated inflation. Determining the best economy under recent presidents must account for Biden's incomplete term and extraordinary circumstances.

Employment recovery accelerated during Biden's first two years, with approximately 15 million jobs created by mid-2023, though many represented positions lost during the pandemic. Unemployment fell to 3.4% by early 2023, matching five-decade lows, before stabilizing around 3.8-4.1% through 2026.
Inflation emerged as the defining economic challenge of Biden's presidency. Consumer prices rose sharply in 2021-2022, reaching levels not seen in four decades. Inflation peaked at approximately 9.1% in mid-2022 before gradually declining toward more normal levels by 2024-2026. This inflation episode eroded real wage gains and reduced household purchasing power despite nominal income growth.
Policy Responses and Fiscal Matters
The administration pursued major spending initiatives including infrastructure investment, semiconductor manufacturing support, and climate-related programs. These represented significant economy and tax policy decisions intended to reshape long-term economic competitiveness.
GDP growth has fluctuated during Biden's tenure, with strong performance in 2021-2023 followed by moderation. Supply chain improvements and labor market normalization have supported continued expansion, though concerns about recession risk have persisted throughout 2024-2026.
Federal deficits remained elevated during Biden's presidency, driven by continued pandemic-related spending, rising interest costs on accumulated debt, and new program expenditures. Critics argue fiscal policy contributed to inflationary pressures, while supporters emphasize the need for public investment.
Academic research, including NBER working papers on macroeconomic performance by president, suggests that presidents receive both too much credit and too much blame for economic outcomes largely shaped by broader forces. Federal Reserve policy, global economic conditions, technological changes, and demographic trends all influence economic performance independent of presidential actions.
Comparing Economic Records: What Matters Most
Determining the best economy under recent presidents depends heavily on which metrics receive greatest weight and how analysts account for inherited conditions versus administration-specific policies.
Job Creation and Employment
By total job creation numbers, Clinton's 22.7 million jobs leads all recent presidents. However, population growth and labor force expansion mean absolute numbers don't tell the complete story. Employment rate changes and unemployment reduction relative to starting points provide additional context.
- Clinton: Started at 7.3% unemployment, ended at 4.2%
- Bush: Started at 4.2%, ended at 7.8%
- Obama: Started at 7.8%, ended at 4.7%
- Trump: Started at 4.7%, ended at 6.7% (pandemic-affected)
- Biden: Started at 6.3%, reached 3.4% low (through 2026)
Obama achieved the largest absolute reduction in unemployment (3.1 percentage points), though he also started from the highest level.
Growth and Prosperity Measures
GDP growth averaged highest under Clinton at 3.9% annually, followed by Trump's pre-pandemic 2.5%, Obama's 2.2%, and Bush's 2.2%. These averages mask significant variation within each presidency and differences in global economic conditions.
Real median household income growth provides perhaps the most direct measure of typical family economic improvement. Clinton-era gains were substantial and broadly distributed. Obama-era recovery eventually restored pre-recession income levels. Trump's tight labor markets produced wage gains for lower-income workers specifically. Biden's nominal income gains have been partially offset by inflation.
Fiscal Responsibility and Debt
Clinton remains the only recent president to achieve budget surpluses, a significant accomplishment for fiscal sustainability. All subsequent presidents have presided over substantial deficits, though economic circumstances and policy priorities varied considerably.
The debt-to-GDP ratio provides context for deficit sustainability. This metric rose sharply during the Bush and Obama years due to recession-related revenue declines and stimulus spending. It increased further during Trump's presidency despite economic growth, then spiked dramatically during the pandemic before stabilizing under Biden.
The Role of External Factors and Timing
Presidential economic records reflect more than just administration policies. Global economic conditions, Federal Reserve monetary policy, technological innovation, and demographic trends all shape economic outcomes.
Clinton benefited from the technology revolution and relatively peaceful international environment. Bush confronted the September 11 attacks, subsequent military conflicts, and the bursting of the housing bubble. Obama inherited the worst financial crisis in generations. Trump faced escalating trade tensions before the pandemic arrived. Biden has navigated pandemic recovery, supply chain disruptions, and geopolitical tensions including the Ukraine conflict.
Monetary Policy Interactions
Federal Reserve decisions profoundly affect economic performance, sometimes reinforcing and sometimes counteracting fiscal policy. The Fed's low interest rate policies during Obama's presidency supported recovery but may have contributed to asset price inflation. Rate increases during late Trump and Biden years aimed to control inflation but raised recession risks.
Presidential influence over the Fed is indirect and constrained by the central bank's independence. However, presidential appointments to the Fed Board shape monetary policy direction over time.
Policy lag effects mean presidents often inherit economic momentum from predecessors while their own policy impacts extend beyond their terms. Bush inherited Clinton's budget surpluses, Obama inherited Bush's recession, Trump inherited Obama's recovery, and Biden inherited Trump's pandemic economy. These inherited conditions substantially influence early-term economic performance.
Lessons for Evaluating Presidential Economics
Assessing the best economy under recent presidents reveals several important lessons about presidential economic influence and measurement challenges.
First, timing matters enormously. Presidents who serve during technological booms or who inherit strong economies enjoy advantages beyond their policy control. Conversely, those facing global shocks or financial crises operate under severe constraints.
Second, multiple indicators tell different stories. A president might achieve low unemployment but weak wage growth, strong GDP expansion but rising inequality, or deficit reduction but slower job creation. No single metric captures complete economic performance.
Third, political perspective shapes interpretation. Conservative analysts emphasize growth rates, deregulation benefits, and private sector job creation. Progressive analysts focus on income distribution, poverty reduction, and public investment returns. These different priorities generate conflicting assessments of identical economic data.
Readers interested in deeper analysis of economic impact news can explore how current policy debates reflect ongoing disagreements about which president truly presided over the best economy and what that means for contemporary governance.
Evaluating which recent president presided over the best economy requires weighing employment gains, growth rates, wage trends, and fiscal responsibility against the unique circumstances each administration faced. While Clinton's 1990s expansion stands out for growth and job creation, each presidency contributed to America's evolving economic story in different ways. For ongoing, non-partisan coverage of how presidential policies shape economic outcomes and all aspects of U.S. governance, visit U.S. Presidential Report for comprehensive analysis and the latest developments from past and present administrations.