The middle class tax burden analysis 2026 reveals significant shifts in how American families navigate their federal, state, and local tax obligations. As tax provisions from previous legislation reach critical transition points, understanding the comprehensive tax landscape has never been more important for households earning between $50,000 and $150,000 annually. This analysis examines the multiple layers of taxation affecting middle-income Americans, from federal income tax brackets to payroll contributions and state-level obligations that collectively shape household budgets.
Federal Income Tax Structure for Middle-Class Households
The federal income tax system operates through progressive brackets, meaning different portions of income are taxed at different rates. For the middle class tax burden analysis 2026, understanding these brackets is foundational to grasping overall tax liability.
Current bracket structure for married couples filing jointly:
| Taxable Income Range | Tax Rate | Effective Impact |
|---|---|---|
| $0 – $23,200 | 10% | Minimal burden on base income |
| $23,201 – $94,300 | 12% | Primary middle-class bracket |
| $94,301 – $201,050 | 22% | Upper middle-class threshold |
| $201,051 – $383,900 | 24% | High-earning households |
The standard deduction for 2026 stands at $29,200 for married couples filing jointly and $14,600 for single filers. These amounts directly reduce taxable income before applying bracket rates, providing substantial relief for middle-income families.
Marginal vs. Effective Tax Rates
Understanding the difference between marginal and effective rates is crucial for accurate tax planning. The marginal rate represents the percentage paid on the last dollar earned, while the effective rate reflects the overall percentage of total income paid in taxes.
A household earning $100,000 with standard deductions faces taxation only on approximately $70,800 of income. Despite reaching the 22% bracket, their effective federal income tax rate typically falls between 8-12%, significantly lower than many assume.

Payroll Tax Contributions and Hidden Burdens
Beyond federal income tax, the comprehensive analysis of the total tax burden on middle-class households must include payroll taxes. These contributions fund Social Security and Medicare programs, representing a substantial portion of overall tax liability.
Payroll tax breakdown for 2026:
- Social Security: 6.2% on earnings up to $168,600
- Medicare: 1.45% on all earnings
- Additional Medicare Tax: 0.9% on earnings above $200,000 (single) or $250,000 (married)
For most middle-class workers, the combined employee-employer payroll tax totals 15.3%. Self-employed individuals bear the full burden themselves, though they can deduct half as a business expense. A household earning $80,000 pays approximately $6,120 annually in employee-side payroll taxes alone.
State and Local Tax Considerations
State and local taxes add another layer to the middle class tax burden analysis 2026, with significant variation across jurisdictions. Seven states impose no income tax, while others reach rates exceeding 10% for middle-income earners.
Geographic Tax Disparities
California residents face top marginal rates of 13.3%, though middle-class earners typically pay 6-8%. Texas collects no income tax but compensates through higher property and sales taxes. Florida's absence of income tax makes it attractive for middle-class families, though property insurance and other costs offset some advantages.
Property taxes represent another substantial burden, averaging 1.1% of home value nationally but reaching 2.5% or higher in states like New Jersey and Illinois. For a middle-class family owning a $300,000 home, annual property taxes might range from $3,300 to $7,500 depending on location.
Sales taxes further compound the burden, with combined state and local rates reaching 9-10% in some areas. These regressive taxes disproportionately affect middle-class households who spend a larger percentage of income on taxable goods.
Policy Changes Affecting 2026 Tax Liability
Several policy developments shape the middle class tax burden analysis 2026 landscape. The key tax changes affecting the middle class include adjustments to standard deductions, child tax credits, and various itemized deduction limitations.
The Tax Cuts and Jobs Act provisions remain in effect through 2025, with potential modifications or extensions under congressional consideration. These provisions doubled standard deductions and limited state and local tax (SALT) deductions to $10,000, significantly impacting middle-class households in high-tax states.
Child Tax Credit Developments
The enhanced Child Tax Credit that provided up to $3,600 per child under age six during the pandemic has reverted to $2,000 per child. This reduction affects millions of middle-class families who previously benefited from the expanded credit.
Child Tax Credit comparison:
| Provision | 2021 Enhanced | 2026 Current |
|---|---|---|
| Maximum credit per child | $3,600 (under 6) | $2,000 |
| Refundability | Fully refundable | $1,700 refundable |
| Income phase-out | Higher thresholds | $400,000 married |
| Monthly advance option | Available | Not available |
Political debates surrounding presidential domestic policy continue influencing these provisions, with proposals ranging from credit expansion to complete restructuring of family tax benefits.
Alternative Tax Policy Proposals and Their Impact
Recent discussions about fundamental tax restructuring have introduced alternative approaches to middle-class taxation. The potential impact of replacing income tax with tariffs presents one such radical proposal, though economic analysis suggests middle-class households would face increased costs.
Tariff-based revenue systems shift the tax burden toward consumption rather than income. While this might reduce direct taxation, the resulting price increases on imported goods effectively function as a regressive tax, disproportionately affecting middle-income families who spend larger portions of income on consumer goods.
Progressive Tax Reform Proposals
Alternative proposals focus on maintaining income-based taxation while adjusting progressivity. The analysis of Senator Van Hollen’s proposed tax policies demonstrates efforts to reduce middle-class burdens while increasing obligations for high earners.
These proposals typically include:
- Expanding the Earned Income Tax Credit for childless workers
- Increasing standard deductions beyond inflation adjustments
- Creating new brackets for million-dollar earners
- Enhancing child care tax credits
- Adjusting capital gains treatment for different income levels
Effective Strategies for Reducing Tax Burden
Middle-class households can employ several legitimate strategies to minimize their tax liability within current law. Understanding these approaches is essential for comprehensive financial planning.
Retirement contribution advantages:
- 401(k) contributions reduce taxable income dollar-for-dollar up to $23,000 in 2026 ($30,500 for those 50 and older)
- Traditional IRA deductions provide similar benefits with income limitations
- Roth conversions during lower-income years can reduce future tax burdens
- Health Savings Accounts offer triple tax advantages when used for medical expenses
Strategic Deduction Timing
Bunching itemized deductions into alternating years can exceed the standard deduction threshold, providing tax benefits. This strategy works particularly well for:
- Charitable contributions made biennially instead of annually
- Medical expense timing when approaching the 7.5% AGI threshold
- State tax prepayments (subject to SALT limitations)
- Mortgage interest acceleration where applicable
The working families tax cuts have targeted specific relief mechanisms designed to benefit middle-income Americans through enhanced credits and deductions.
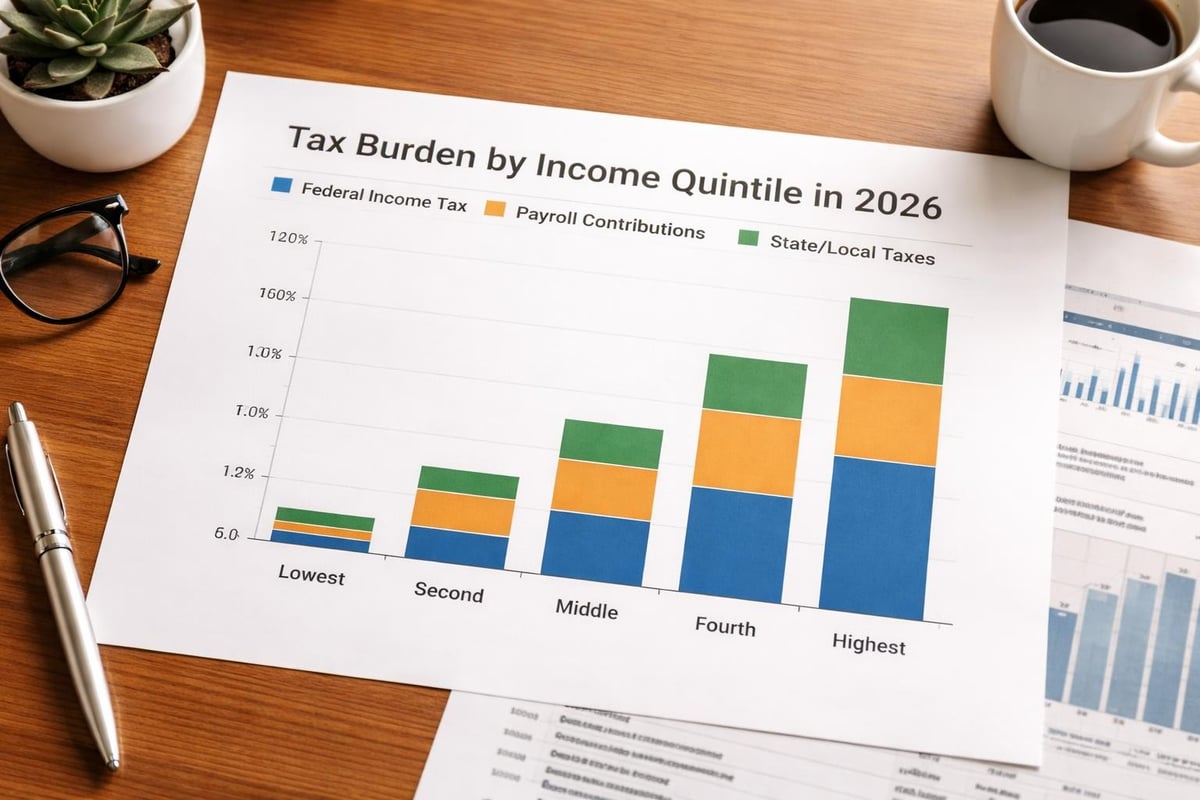
Comparing Tax Burdens Across Income Levels
The middle class tax burden analysis 2026 gains important context when compared to other income groups. The analysis showing how recent legislation affects different income groups reveals disparate impacts across the economic spectrum.
Effective tax rates by income quintile:
| Income Quintile | Average Income | Effective Federal Rate | Total Tax Burden |
|---|---|---|---|
| Lowest 20% | $15,000 | -5% to 0% | 10-15% (all taxes) |
| Second 20% | $35,000 | 2-5% | 18-22% |
| Middle 20% | $65,000 | 8-11% | 24-28% |
| Fourth 20% | $110,000 | 12-15% | 28-32% |
| Top 20% | $250,000+ | 18-25% | 32-40% |
These figures demonstrate that middle-class households face substantial total tax burdens when combining federal, state, local, and payroll obligations. The progressive structure of federal income tax is partially offset by regressive payroll and sales taxes.
Documentation and Compliance Requirements
Proper documentation forms the foundation of accurate tax reporting and audit defense. Middle-class households should maintain comprehensive records of:
- W-2 and 1099 forms documenting all income sources
- Receipt substantiation for itemized deductions
- Retirement account contribution confirmations
- Health insurance coverage documentation
- Child care provider tax identification numbers
- Home office measurements and expense allocation
Digital record-keeping best practices:
- Scan and store receipts in cloud-based systems with redundant backups
- Categorize expenses monthly rather than annual scrambling
- Photograph mileage logs and business-related travel
- Save email confirmations for charitable contributions
- Maintain separate accounts for business and personal transactions
The IRS generally has three years to audit returns, though certain circumstances extend this period to six years or indefinitely for fraud. Maintaining organized records for at least seven years provides comprehensive protection.
Impact of Presidential Policy on Middle-Class Taxation
Presidential administrations significantly influence tax policy through legislative proposals, regulatory changes, and enforcement priorities. Understanding how presidential policies affect household budgets helps middle-class families anticipate and adapt to changing tax landscapes.
Recent analysis indicates that middle-class Americans may pay approximately $900 more in taxes under certain policy shifts, highlighting the direct connection between political decisions and household finances. These changes stem from modifications to deductions, credits, and bracket adjustments that collectively impact take-home pay.
Legislative Timeline and Uncertainty
Tax policy rarely remains static, with Congress regularly considering modifications to rates, deductions, and credits. The 2026 middle class tax burden analysis must account for potential changes as major provisions approach expiration dates.
Key dates affecting middle-class taxation include:
- December 31, 2025: Expiration of several TCJA individual provisions
- Ongoing: State-level tax code modifications
- Annual: Inflation adjustments to brackets and deductions
- Quarterly: Estimated tax payment deadlines for self-employed
Planning for Multiple Tax Scenarios
Given political uncertainty surrounding tax policy, middle-class households benefit from scenario planning that accounts for various legislative outcomes. This approach acknowledges that the middle class tax burden analysis 2026 represents a snapshot rather than a guaranteed future.
Scenario planning matrix:
| Scenario | Probability | Middle-Class Impact | Action Steps |
|---|---|---|---|
| Extension of current law | Moderate | Stable burden | Maintain current strategies |
| Partial provision expiration | High | Increased burden | Accelerate deductions |
| Progressive reform | Moderate | Reduced burden | Delay income recognition |
| Comprehensive overhaul | Low | Uncertain | Maximize flexibility |
This matrix helps households prepare for multiple outcomes without overcommitting to strategies that assume specific legislative results.
Understanding the middle class tax burden analysis 2026 requires examining federal income taxes, payroll contributions, state and local obligations, and emerging policy proposals that collectively shape household finances. The strategies and insights outlined above provide a framework for navigating this complex landscape while maintaining compliance and minimizing unnecessary tax liability. For comprehensive coverage of how presidential policies and congressional actions affect your financial future, U.S. Presidential Report delivers non-partisan analysis of the political decisions shaping American taxation and economic policy.