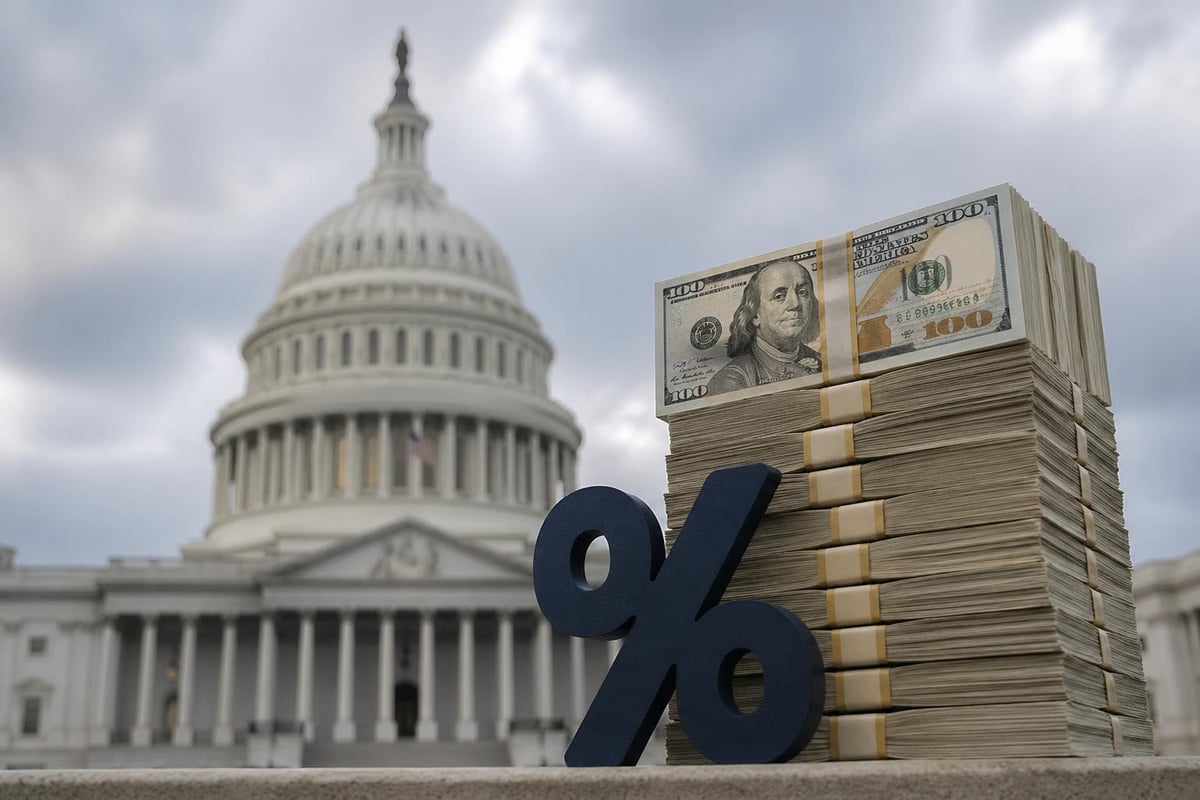
The federal spending increase breakdown 2026 reveals significant shifts in how taxpayer dollars are allocated across government programs and obligations. As the United States confronts evolving economic challenges, understanding where additional federal funds are directed becomes crucial for citizens, policymakers, and political observers. This year's budget expansion reflects both deliberate policy choices and unavoidable fiscal pressures that shape the nation's financial trajectory.
Understanding the Overall Spending Increase
The federal government's budget for 2026 shows substantial growth compared to previous fiscal years. Total federal outlays are projected to increase by approximately $350 billion from 2025 levels, pushing total spending beyond $6.8 trillion. This expansion represents roughly a 5.4% year-over-year increase, driven primarily by mandatory spending programs rather than discretionary allocations.
Several key factors contribute to this growth:
- Automatic inflation adjustments for Social Security and other indexed benefits
- Rising healthcare costs affecting Medicare and Medicaid
- Increasing debt service payments due to higher interest rates
- Expanded veteran benefits and services
- Cost-of-living adjustments for federal employees and retirees
The Congressional Budget Office’s baseline projections for fiscal year 2026 indicate that while revenues are also climbing, the growth in spending continues to outpace income collection, widening the deficit gap.
Mandatory Spending Dominates the Increase
Mandatory spending programs account for approximately 68% of total federal outlays in 2026, and these same programs drive the overwhelming majority of spending increases. The federal spending increase breakdown 2026 shows that Social Security, Medicare, and Medicaid alone consume nearly $250 billion of the additional spending.

Social Security Expansion
Social Security expenditures are increasing by approximately $85 billion in 2026, primarily due to:
- Cost-of-Living Adjustments (COLA) – Benefits increased by 2.6% to account for inflation
- Growing Beneficiary Population – An estimated 3.2 million additional retirees and disabled individuals
- Higher Average Benefits – New retirees claiming benefits based on higher lifetime earnings
- Survivors and Dependents – Expanded coverage for qualifying family members
The program now serves over 70 million Americans with total outlays exceeding $1.5 trillion annually. These increases are automatic under current law and require no congressional action.
Healthcare Program Growth
Medicare and Medicaid represent the second-largest component of the federal spending increase breakdown 2026. Combined, these programs add roughly $120 billion to federal outlays this year.
| Program | 2026 Spending | Year-over-Year Increase | Primary Growth Factors |
|---|---|---|---|
| Medicare | $1.02 trillion | +$72 billion | Enrollment growth, prescription drug costs |
| Medicaid | $616 billion | +$48 billion | State matching expansions, provider rates |
| Children's Health Insurance | $18 billion | +$2 billion | Coverage expansion |
Medicare enrollment continues expanding as Baby Boomers age into eligibility. The program now covers approximately 67 million Americans. Meanwhile, prescription drug costs under Medicare Part D have escalated faster than anticipated, despite recent reform efforts.
Research on how federal spending cuts will increase healthcare costs in 2026 demonstrates the complex interplay between federal budget decisions and healthcare accessibility, particularly regarding Medicaid funding.
Defense and National Security Allocations
Defense spending represents the largest discretionary category in the federal budget. For 2026, the Department of Defense receives $886 billion in total funding, an increase of $38 billion from the previous year.
This expansion supports several strategic priorities:
- Personnel Costs – A 4.5% military pay raise affecting 2.1 million service members
- Modernization Programs – Advanced weapons systems and technology development
- Readiness Improvements – Enhanced training, maintenance, and operational preparedness
- Global Posture – Expanded presence in Indo-Pacific and European theaters
- Space and Cyber – Growing investments in emerging warfare domains
The defense budget also includes $33 billion for the Department of Energy's nuclear weapons programs and $75 billion for veteran healthcare through the Veterans Affairs Department.
Interest on National Debt Surges
Perhaps the most concerning element of the federal spending increase breakdown 2026 is the dramatic rise in net interest payments on the national debt. These payments now exceed $950 billion annually, representing an increase of more than $140 billion from 2025.
This surge results from two compounding factors:
The total national debt has grown to approximately $35.8 trillion, requiring higher absolute interest payments. Simultaneously, interest rates remain elevated compared to the ultra-low rates of the previous decade, with the 10-year Treasury averaging around 4.3% through early 2026.
Unlike spending on Social Security or defense, interest payments provide no services or benefits to Americans. These funds simply service existing obligations. Analysis from the Committee for a Responsible Federal Budget projects that interest costs will continue consuming an ever-larger share of federal resources over the coming decade.
Discretionary Spending Categories
Beyond defense, discretionary spending covers a wide range of government functions. The federal spending increase breakdown 2026 allocates approximately $917 billion to non-defense discretionary programs, a modest increase of $28 billion.
Key Areas of Non-Defense Discretionary Spending
Education and Training – The Department of Education receives $88 billion, with increases focused on Title I grants for disadvantaged students and special education funding. Pell Grant maximum awards increased to $7,595 for the 2026-2027 academic year.
Transportation Infrastructure – The Department of Transportation's $105 billion budget continues implementing the Infrastructure Investment and Jobs Act, funding highway maintenance, public transit systems, and airport modernization.
Scientific Research – Federal research agencies including NASA, NSF, and NIH received combined increases of $8.2 billion to advance space exploration, medical research, and fundamental science.
Housing and Community Development – HUD programs expand rental assistance vouchers and homelessness prevention initiatives with a $12 billion increase.
The comprehensive breakdown of the 2026 federal budget provides detailed allocations across dozens of agencies and programs.
Revenue Projections and the Growing Deficit
While the federal spending increase breakdown 2026 reveals substantial growth in outlays, revenue collection is also rising. Total federal revenues are projected to reach approximately $5.1 trillion, an increase of roughly $220 billion from 2025.
Primary revenue sources include:
- Individual Income Taxes – $2.73 trillion (53.5% of total revenue)
- Payroll Taxes – $1.65 trillion (32.4% of total revenue)
- Corporate Income Taxes – $491 billion (9.6% of total revenue)
- Other Sources – $229 billion (4.5% of total revenue)
Despite revenue growth, the spending increase significantly outpaces income gains. The deficit for fiscal year 2026 is projected to reach approximately $1.72 trillion, compared to $1.59 trillion in 2025. This represents 6.1% of GDP, a level historically associated only with recessions or wartime emergencies.
Data on the percentage change in total U.S. government spending illustrates these trends across multiple time horizons and government levels.
State and Local Transfer Payments
Federal transfers to state and local governments represent a significant component of the federal spending increase breakdown 2026. These grants total approximately $1.2 trillion and support crucial services delivered at the state and local level.
| Grant Category | 2026 Allocation | Purpose |
|---|---|---|
| Medicaid Matching | $616 billion | Healthcare for low-income populations |
| Highway/Transportation | $68 billion | Road construction and transit |
| Education Grants | $89 billion | K-12 and special education support |
| Housing Assistance | $51 billion | Section 8 vouchers and public housing |
| Other Programs | $376 billion | Various state/local initiatives |
These intergovernmental transfers have increased by approximately $44 billion from 2025, primarily driven by Medicaid expansion and infrastructure investments.
Long-Term Fiscal Implications
The federal spending increase breakdown 2026 represents more than a single year's budget decisions. Current trajectories suggest these growth patterns will accelerate in coming years, creating significant long-term fiscal challenges.
Demographic trends particularly impact future spending:
The ratio of workers to retirees continues declining as the population ages. In 2026, there are approximately 2.7 workers per Social Security beneficiary, down from 3.3 in 2005. By 2035, this ratio will fall to just 2.3 workers per beneficiary, fundamentally challenging program sustainability.
Healthcare cost inflation persistently exceeds general price inflation, meaning Medicare and Medicaid will consume growing shares of GDP regardless of coverage expansion. Medical services and pharmaceuticals have increased an average of 5.8% annually over the past decade, compared to overall inflation averaging 3.2%.
The Congressional Budget Office projects that if current policies continue unchanged, mandatory spending and interest payments will consume virtually all federal revenues by the mid-2030s, leaving no room for discretionary programs including defense, education, or infrastructure without massive borrowing.
Presidential Influence on Spending Patterns
Presidential administrations shape spending priorities through budget proposals, though Congress maintains constitutional authority over appropriations. The 2026 budget reflects negotiations between executive priorities and legislative realities, with political dynamics influencing final allocations.
Recent presidential emphasis on infrastructure modernization is evident in transportation and broadband spending increases. Similarly, enhanced veterans' benefits reflect bipartisan legislative initiatives championed by recent administrations. Analysis of presidential policy decisions helps contextualize how executive leadership influences fiscal outcomes.
However, the president's ability to control overall spending growth is limited. Mandatory programs operate on autopilot under existing statutes, and interest payments are unavoidable contractual obligations. Discretionary spending, where presidents exert more influence, represents only about 27% of total outlays and faces political constraints in both directions.
Comparing 2026 to Historical Spending Patterns
Placing the federal spending increase breakdown 2026 in historical context reveals important trends. As a percentage of GDP, total federal spending in 2026 stands at approximately 24.1%, elevated compared to the 50-year average of 20.8%.
This elevated spending level reflects several factors beyond temporary pandemic-related measures. The aging population drives structural increases in retirement and healthcare spending. Defense spending has normalized at higher post-9/11 levels. Most significantly, interest costs are reverting to historical norms after a decade of artificially suppressed rates.
The analysis of federal spending distribution demonstrates how budget composition has evolved over recent decades, with mandatory programs consuming progressively larger shares.
Reform Proposals and Fiscal Sustainability
Addressing long-term fiscal imbalances requires substantial policy changes. Various reform proposals aim to moderate spending growth or increase revenues, though political consensus remains elusive.
Potential reform approaches include:
- Adjusting Social Security formulas – Raising retirement age, modifying COLA calculations, means-testing benefits
- Medicare structural changes – Premium support models, enhanced means-testing, delivery system reforms
- Tax code modifications – Broadening the base, eliminating deductions, adjusting rates
- Healthcare cost containment – Price transparency requirements, negotiation authority, fraud prevention
- Discretionary spending restraint – Caps, across-the-board reductions, efficiency initiatives
Each approach involves difficult tradeoffs between competing priorities and constituencies. Budget watchdog organizations emphasize the urgency of addressing these structural imbalances before they become unmanageable.
Economic Impact of Spending Increases
The federal spending increase breakdown 2026 carries broad economic implications beyond government accounts. Increased federal spending can stimulate economic activity in the short term, particularly when directed toward infrastructure or income support programs.
However, persistent deficits requiring substantial borrowing may crowd out private investment by absorbing available capital. When government borrowing demands compete with private sector needs, interest rates can rise, making business expansion and consumer purchases more expensive.
The Federal Reserve's monetary policy must account for fiscal conditions, creating complex interactions between budget decisions and economic management. Large deficits during periods of economic growth reduce policy flexibility when recessions arrive and countercyclical measures become necessary.
Additionally, growing debt service obligations mean fewer resources available for productive investments in education, infrastructure, or research that drive long-term economic growth and competitiveness.
The federal spending increase breakdown 2026 illustrates fundamental fiscal challenges facing the United States as mandatory programs and interest obligations consume growing shares of the budget. Understanding these trends and their implications for national governance requires ongoing attention to policy developments and presidential leadership. For comprehensive, non-partisan coverage of how current and past presidents navigate these critical fiscal decisions, U.S. Presidential Report delivers reliable analysis of budget policies, economic initiatives, and their impact on America's financial future.