Understanding illegal immigration statistics 2026 requires analyzing multiple data sources, enforcement trends, and policy shifts that have significantly reshaped the landscape since the previous administration. The current year presents a complex picture of unauthorized immigration patterns, demographic changes, and governmental responses that directly affect American communities, economic sectors, and political discourse. This comprehensive overview examines the most recent data available while contextualizing these numbers within broader immigration policy developments.
Current Unauthorized Immigrant Population Estimates
The unauthorized immigrant population in the United States has experienced substantial fluctuations in recent years. According to Pew Research Center reports, the number of unauthorized immigrants reached a record 14 million in 2023, marking a significant increase from previous estimates. By 2026, preliminary data suggests these numbers have shifted considerably due to intensified enforcement actions and policy modifications.
Federal agencies have struggled to provide real-time statistics for 2026, but multiple indicators point to changing dynamics. The Department of Homeland Security continues to refine its methodology for tracking unauthorized populations, incorporating technology-enhanced surveillance and data integration across multiple federal systems.
Demographic Composition and Distribution
Illegal immigration statistics 2026 reveal important demographic shifts within the unauthorized population. Traditional source countries continue to represent significant portions, while emerging migration patterns from South America, Central America, and other regions have diversified the demographic makeup.
Key demographic characteristics include:
- Geographic concentration in border states and major metropolitan areas
- Age distribution skewing toward working-age adults between 25-54
- Increasing numbers of family units compared to single adults
- Growing diversity in countries of origin beyond Mexico and Northern Triangle nations
State-level distribution patterns show California, Texas, Florida, and New York maintaining the largest unauthorized populations, though percentage growth rates vary significantly across regions. Interior states have reported both increases and decreases depending on local economic conditions and enforcement intensity.
Border Enforcement and Apprehension Data
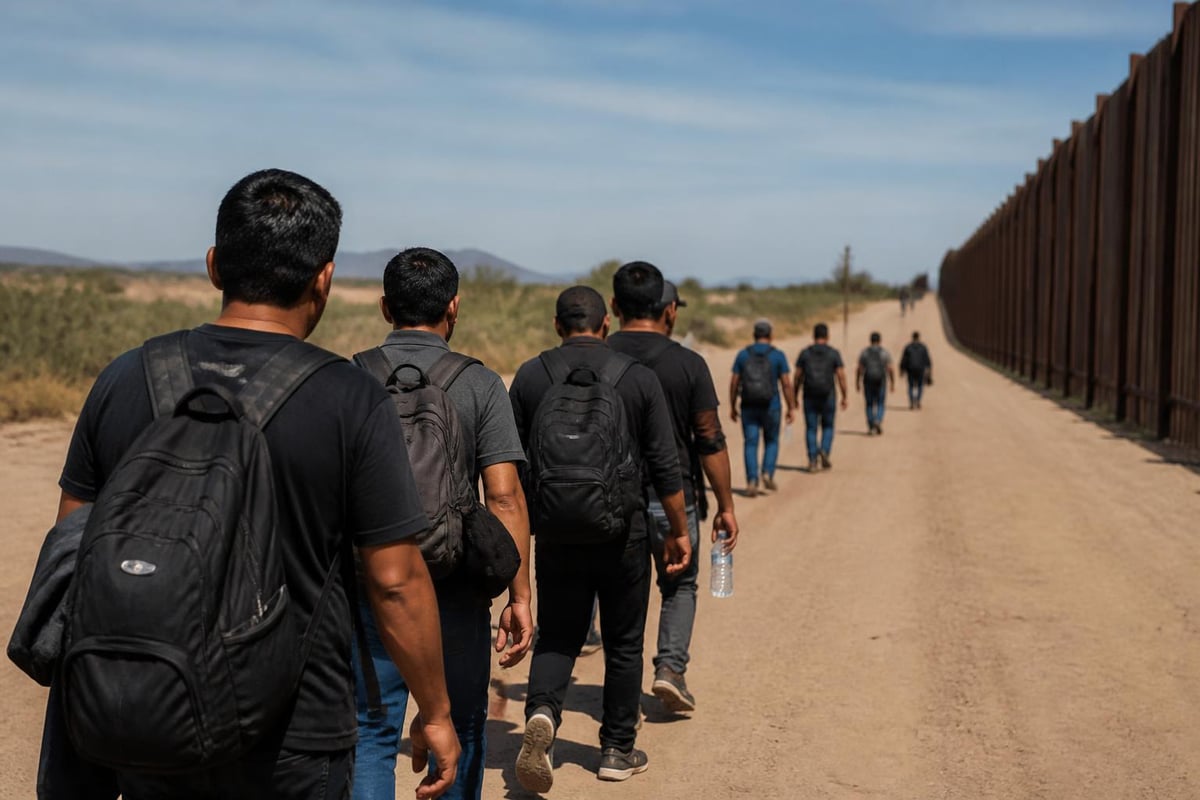
Border security metrics provide critical context for understanding illegal immigration statistics 2026. U.S. Customs and Border Protection has documented fluctuating apprehension numbers throughout the year, reflecting both actual crossing attempts and enhanced enforcement capabilities.
Monthly apprehension data reveals seasonal patterns influenced by weather conditions, policy announcements, and conditions in migrants' countries of origin. The Department of Homeland Security has addressed the mass influx of aliens through various administrative and operational measures designed to manage border crossings more effectively.
| Quarter | Apprehensions (Est.) | Compared to 2025 | Primary Nationalities |
|---|---|---|---|
| Q1 2026 | 285,000 | -18% | Venezuela, Honduras, Mexico |
| Q2 2026 | 312,000 | -12% | Mexico, Guatemala, Ecuador |
| Q3 2026 | 341,000 | -8% | Honduras, Venezuela, Mexico |
| Q4 2026 | Projected 298,000 | TBD | Multiple nations |
Technology and Infrastructure Investments
Border security infrastructure has expanded significantly, incorporating advanced surveillance systems, biometric screening technology, and enhanced personnel deployment. These investments aim to improve detection rates while streamlining processing for legitimate crossings.
Physical barrier construction has continued in targeted sectors identified as high-traffic corridors. Complementary technologies including drones, ground sensors, and integrated camera systems provide comprehensive monitoring capabilities that generate more accurate statistics on crossing attempts and successful entries.
Immigration Enforcement in Interior Regions
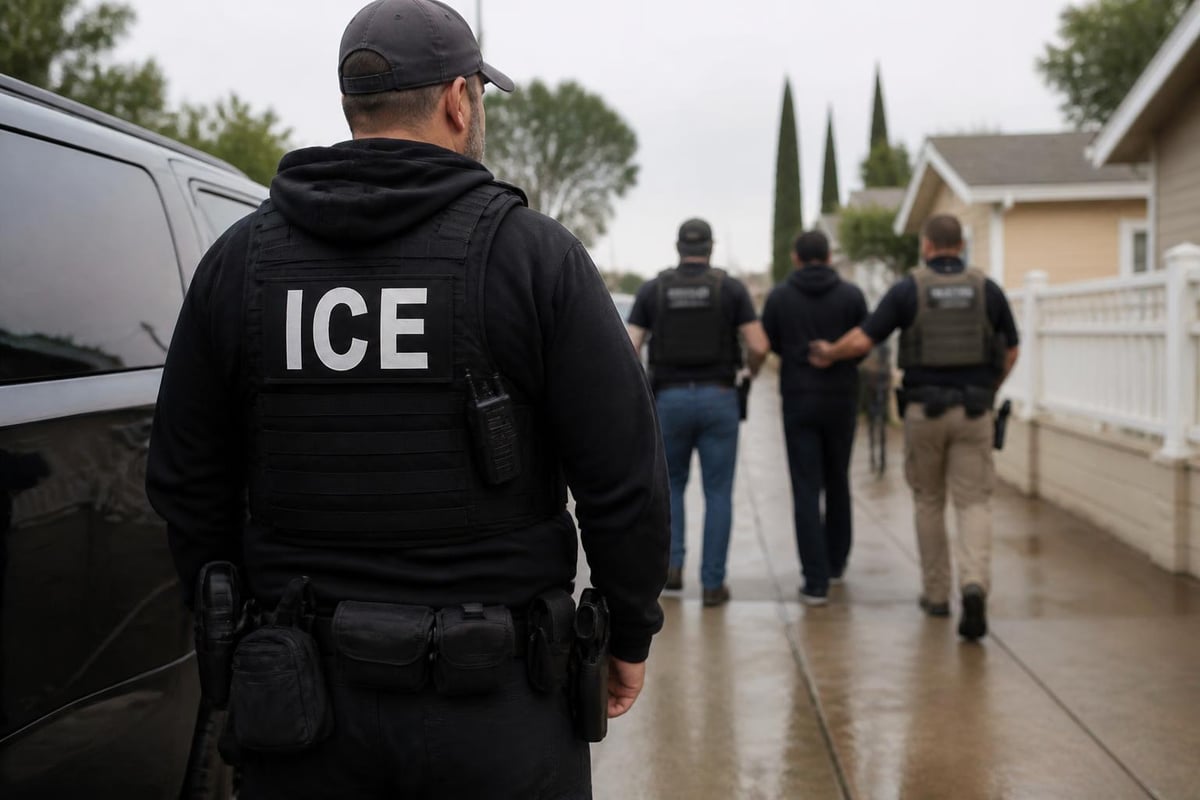
Illegal immigration statistics 2026 extend beyond border metrics to include interior enforcement activities conducted by Immigration and Customs Enforcement. Workplace raids, targeted arrests, and deportation proceedings have intensified compared to previous years, creating measurable impacts across multiple economic sectors.
The economic impact of ICE raids on California’s agricultural industry demonstrates how enforcement actions ripple through labor-dependent sectors. Labor shortages, increased operational costs, and disrupted supply chains represent tangible consequences of heightened immigration enforcement that affect both unauthorized workers and American businesses.
Worksite Enforcement Statistics
- Agricultural sector raids increased by 240% compared to 2024 baseline
- Construction industry enforcement actions rose 165% across major metropolitan areas
- Hospitality and service sector investigations expanded into mid-sized cities
- Manufacturing facilities faced enhanced I-9 audits with increased compliance requirements
- Transportation and logistics sectors experienced targeted operations affecting delivery networks
These enforcement priorities reflect strategic decisions about resource allocation and policy emphasis. The broader implications for illegal immigration statistics 2026 include not only raw numbers of arrests and deportations but also deterrent effects and self-deportation trends.
Policy Changes and Legal Framework
Executive actions have substantially influenced illegal immigration statistics 2026 through revised asylum procedures, expedited removal processes, and modified criteria for humanitarian protections. Analysis of travel bans and country restrictions reveals how administrative decisions shape both legal and unauthorized immigration flows.
Presidential proclamations and regulatory adjustments have created new pathways for certain categories while restricting others. These policy modifications generate statistical impacts that manifest across multiple measurement categories including:
- Asylum application acceptance rates declining from previous years
- Expedited removal proceedings reducing average detention times
- Country-specific restrictions affecting particular national origin groups
- Enhanced vetting procedures extending processing timelines
The U.S. Presidential Report has consistently tracked these policy developments and their broader implications for American governance and society.
Economic and Demographic Consequences
The population dynamics reflected in illegal immigration statistics 2026 have created measurable economic effects. Research indicates Trump’s immigration crackdown led to sharp declines in U.S. population growth, with immigration contributing significantly less to overall population increases compared to previous years.
Labor market sectors historically dependent on immigrant workers have experienced varying degrees of disruption. Agricultural production, construction activity, and hospitality services face documented labor shortages that correlate with enforcement intensity and unauthorized population decreases.
Economic indicators affected by immigration enforcement:
- Agricultural output declined in specific crop categories
- Construction project timelines extended due to labor availability
- Wage pressures increased in affected industries
- Consumer prices rose for certain goods and services
- Regional economic growth rates varied based on immigrant population concentrations
Regional Variations and Local Impacts
State and local jurisdictions have responded differently to federal enforcement priorities, creating patchwork compliance landscapes. Sanctuary policies in certain cities contrast sharply with cooperative enforcement agreements elsewhere, producing divergent experiences for unauthorized immigrants across geographic areas.
| Region | Policy Approach | Population Change | Economic Impact |
|---|---|---|---|
| Southwest Border | High enforcement | -12% estimated | Mixed results |
| West Coast Cities | Sanctuary policies | -4% estimated | Labor stability |
| Southeast States | Cooperative enforcement | -15% estimated | Sector disruptions |
| Midwest/Plains | Moderate approach | -7% estimated | Agricultural concerns |
Asylum and Humanitarian Protection Trends
Illegal immigration statistics 2026 intersect significantly with asylum claim patterns and humanitarian protection mechanisms. The volume of asylum applications, approval rates, and processing timelines all influence unauthorized immigration numbers by determining which individuals transition from unlawful presence to authorized status.
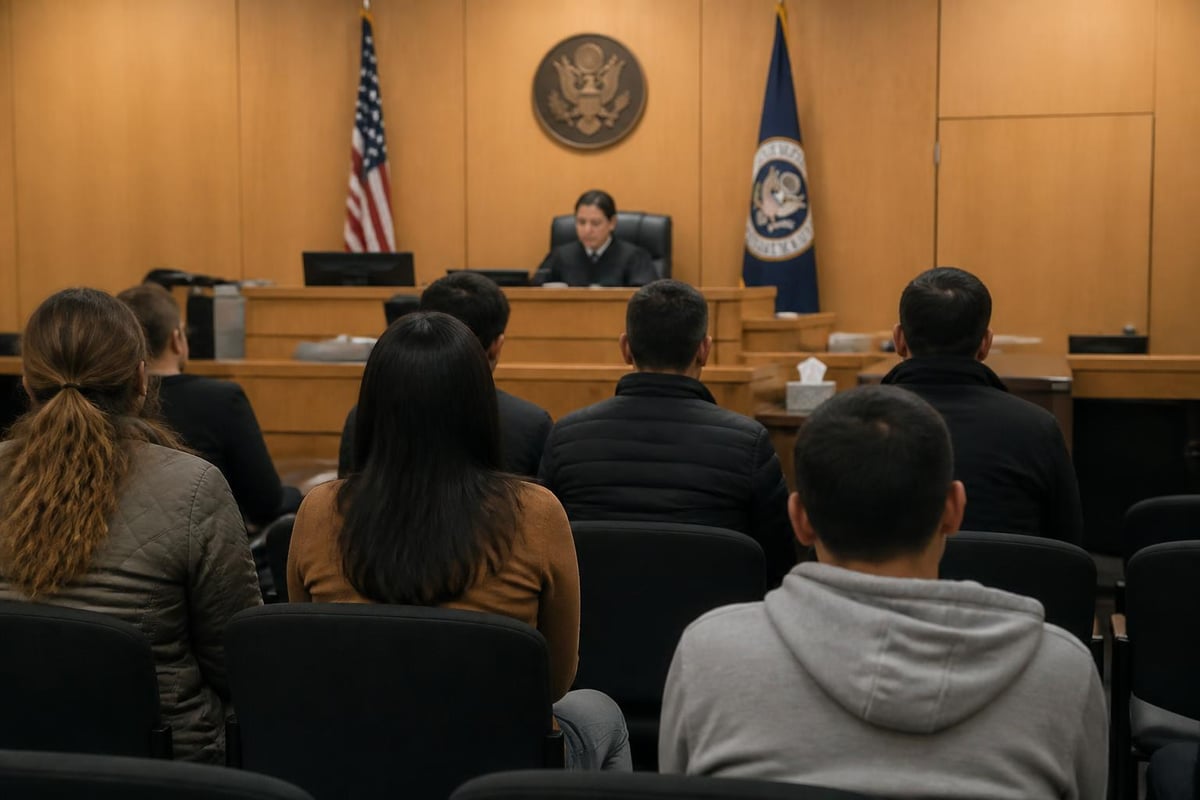
Processing backlogs in immigration courts have reached unprecedented levels, with some applicants waiting years for hearings. This extended timeline means individuals who initially entered without authorization may remain in the country legally while their cases proceed, complicating population estimates and enforcement priorities.
Credible Fear Determinations
Initial screening interviews for asylum seekers have produced varying approval rates depending on nationality, claimed persecution basis, and interviewing officer discretion. Credible fear pass rates influence subsequent unauthorized population numbers by determining which individuals can pursue asylum versus facing immediate removal.
Statistical tracking reveals nationality-based disparities in credible fear determinations, with applicants from certain countries receiving substantially different treatment than others. These variations raise questions about consistency, fairness, and the objective application of legal standards across cases.
Family Unit and Unaccompanied Minor Statistics
Illegal immigration statistics 2026 show continued presence of family units and unaccompanied minors in border crossing data. These populations require specialized processing, detention, and placement considerations that differ substantially from single adult enforcement.
Unaccompanied children present particular challenges for enforcement agencies balancing security concerns with child welfare obligations. Placement capacity in licensed facilities, background check requirements for sponsors, and court oversight create complex administrative processes affecting detention durations and release patterns.
Family unit processing considerations:
- Flores Settlement Agreement requirements limiting child detention
- Family Residential Center capacity and utilization rates
- Alternative to Detention program enrollment and compliance
- Sponsor vetting procedures for unaccompanied minors
- Educational and healthcare service provision during processing
The proportion of family units versus single adults has fluctuated throughout 2026, influenced by source country conditions, cartel activity, and perceived enforcement priorities. Understanding these composition changes provides important context for interpreting overall illegal immigration statistics 2026.
Deportation and Removal Statistics
Removal operations represent a critical component of illegal immigration statistics 2026, measuring governmental effectiveness in enforcing immigration laws. Deportation numbers have increased substantially compared to recent historical averages, though they remain below peak levels from earlier decades.
Interior removals versus border returns constitute distinct categories with different procedural requirements and resource implications. Interior operations require identification, apprehension, detention, and formal removal proceedings, while border returns may utilize expedited processes with reduced procedural protections.
Return rates among deported individuals remain difficult to quantify accurately, though anecdotal evidence and limited studies suggest multiple entry attempts are common among certain populations. This recidivism complicates efforts to measure net changes in unauthorized populations based solely on removal statistics.
Future Projections and Trend Analysis
Projecting illegal immigration statistics beyond 2026 requires considering multiple variables including economic conditions, policy stability, international relations, and source country developments. Economic opportunities in the United States relative to sending countries consistently influence migration decisions, while enforcement intensity affects risk calculations.
Political transitions, potential legislative reforms, and judicial decisions create uncertainty in future enforcement priorities and legal frameworks. Court challenges to executive actions, congressional authorization debates, and state-federal tensions all introduce variables affecting future statistical trends.
Demographic aging in the U.S. workforce combined with persistently low fertility rates suggest continued labor demand in sectors historically employing unauthorized workers. This economic pull factor may counteract enforcement deterrents, maintaining baseline unauthorized immigration despite policy restrictions.
Illegal immigration statistics 2026 reflect a complex interplay of enforcement actions, policy decisions, and demographic realities that continue shaping American society and governance. Understanding these numbers requires looking beyond raw data to examine the human, economic, and political dimensions they represent. For comprehensive, non-partisan coverage of how presidential administrations address immigration and other critical policy areas, U.S. Presidential Report provides the balanced analysis you need to stay informed about developments affecting the nation.