The federal budget deficit continues to dominate fiscal policy discussions as the United States grapples with unprecedented spending levels and revenue challenges. As policymakers navigate competing priorities and economic uncertainties, understanding the trajectory of deficit spending becomes essential for citizens, investors, and political observers. This federal budget deficit 2026 analysis examines current projections, underlying drivers, and potential implications for the nation's fiscal health during a critical election cycle and beyond.
Current Deficit Projections and Economic Outlook
The Congressional Budget Office (CBO) has released sobering projections regarding the nation's fiscal trajectory for 2026 and the subsequent decade. According to recent analysis by the Committee for a Responsible Federal Budget, the federal government is expected to run a deficit exceeding $1.9 trillion in fiscal year 2026, representing approximately 6.2 percent of gross domestic product.
These numbers reflect a concerning trend that has persisted across multiple administrations. The deficit has grown substantially from pre-pandemic levels, and structural factors suggest limited prospects for meaningful reduction without significant policy interventions.
Key Fiscal Metrics for 2026
Budget deficit projections reveal several critical data points:
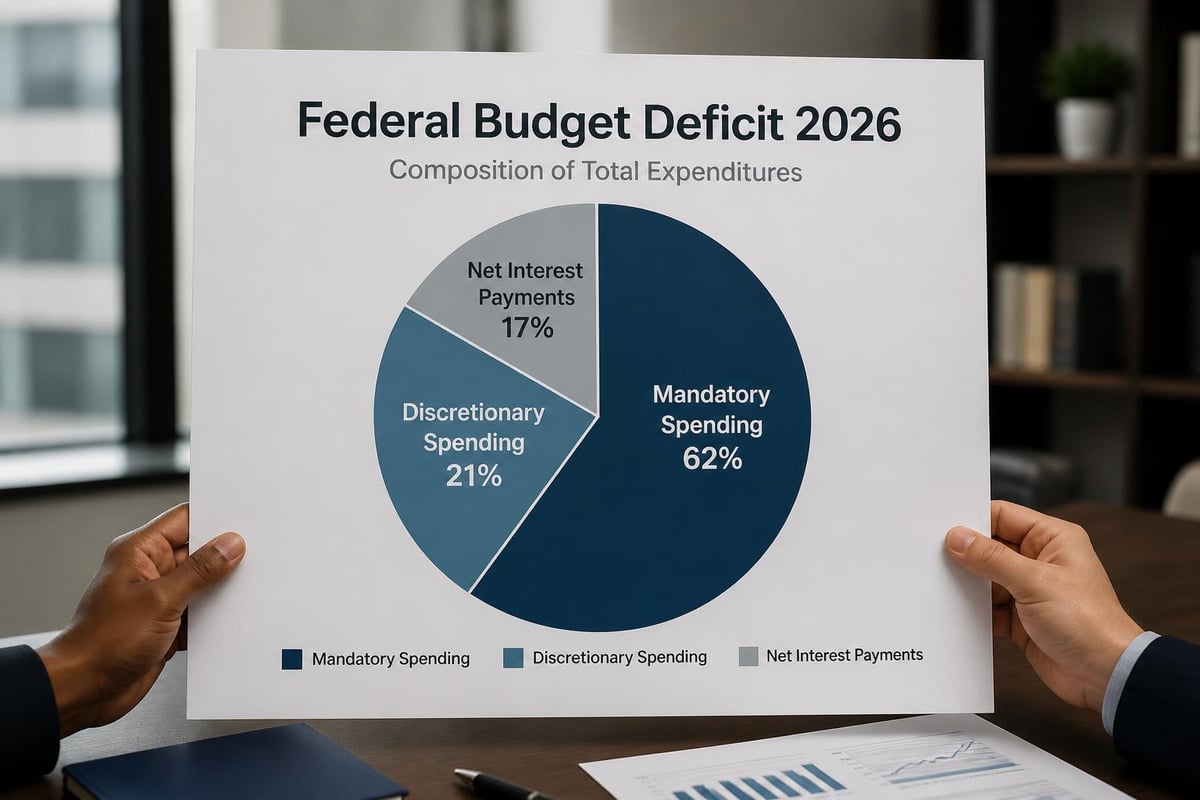
- Total federal spending projected at $7.3 trillion
- Federal revenue estimated at $5.4 trillion
- Net interest costs approaching $950 billion
- Deficit-to-GDP ratio remaining elevated at 6.2%
The gap between revenue and expenditures continues widening despite periods of economic growth. This persistent structural imbalance raises questions about long-term sustainability and the nation's capacity to respond to future economic shocks or emergencies.
| Fiscal Metric | 2026 Projection | Percentage of GDP |
|---|---|---|
| Total Revenue | $5.4 trillion | 17.8% |
| Total Spending | $7.3 trillion | 24.0% |
| Budget Deficit | $1.9 trillion | 6.2% |
| Net Interest | $950 billion | 3.1% |
Primary Drivers of Deficit Growth
Understanding what drives deficit expansion requires examining both the spending and revenue sides of the federal ledger. Multiple factors contribute to the widening gap, with some representing temporary pressures while others reflect permanent structural challenges.
Mandatory Spending Pressures
Mandatory spending programs constitute the largest and fastest-growing portion of the federal budget. The Associated Press has reported that Social Security, Medicare, and Medicaid alone account for the majority of spending increases projected through 2036.
Demographic trends amplify these pressures:
- Baby boomer retirements increasing Social Security beneficiaries
- Rising healthcare costs per Medicare enrollee
- Extended life expectancies expanding benefit duration
- Limited workforce growth constraining revenue collection
Social Security spending is projected to reach $1.7 trillion in 2026, while Medicare costs approach $1.1 trillion. These programs operate largely on autopilot, with spending determined by eligibility formulas rather than annual appropriations.
Medicaid adds another $616 billion in federal spending, though this figure varies with economic conditions and state-level policy decisions. Together, these three programs consume approximately 50 percent of all federal expenditures.
Interest Cost Escalation
Net interest payments represent the fastest-growing category of federal spending, creating a dangerous fiscal spiral. As the national debt surpasses $36 trillion and interest rates remain elevated compared to the low-rate environment of the 2010s, the Treasury faces mounting costs simply to service existing obligations.
The federal budget deficit 2026 analysis must account for interest expenses approaching $1 trillion annually. This represents money that generates no public services, builds no infrastructure, and provides no benefits to citizens. Every dollar spent on interest is unavailable for defense, education, research, or other government functions.
Interest cost growth reflects multiple factors:
- Accumulated debt from previous deficits
- Higher interest rates compared to 2010-2021 period
- Continued deficit spending adding to principal
- Refinancing older debt at current market rates
This creates a self-reinforcing cycle where deficits increase debt, which increases interest costs, which increases deficits further. Breaking this cycle requires either spending reductions, revenue increases, or economic growth substantial enough to shrink the debt-to-GDP ratio.
Revenue Challenges and Tax Policy
While spending receives considerable attention in deficit discussions, the revenue side presents equally significant challenges. Federal tax collections as a share of GDP remain below historical averages despite recent economic growth.
Tax policy debates often focus on competing priorities: economic efficiency versus revenue adequacy, horizontal equity versus vertical redistribution, and simplicity versus targeted incentives. These tensions complicate efforts to address revenue shortfalls through tax reform.
Current Revenue Landscape
Federal revenue in 2026 stems from several primary sources, each facing distinct challenges and opportunities. Individual income taxes provide the largest share at approximately 50 percent of total revenue, followed by payroll taxes at 36 percent, corporate income taxes at 9 percent, and other sources comprising the remainder.
| Revenue Source | 2026 Estimate | Share of Total |
|---|---|---|
| Individual Income Tax | $2.7 trillion | 50% |
| Payroll Tax | $1.9 trillion | 36% |
| Corporate Income Tax | $486 billion | 9% |
| Other Revenue | $270 billion | 5% |
Tax policy changes enacted in previous years continue influencing revenue collections in 2026. Some provisions from the 2017 tax legislation remain in effect, while others have expired or been modified through subsequent legislation.
Political Dynamics and Policy Options
The federal budget deficit 2026 analysis cannot ignore the political context shaping fiscal policy decisions. With presidential and congressional elections scheduled for November 2026, deficit reduction faces significant political headwinds despite broad public concern about national debt levels.
Different political factions propose vastly different approaches to fiscal challenges. Some emphasize spending restraint and entitlement reform, others prioritize revenue increases on high earners and corporations, while still others argue that economic growth can resolve fiscal imbalances without painful policy adjustments.
Partisan Perspectives on Deficit Reduction
Republicans typically advocate for spending discipline, arguing that government growth crowds out private sector activity and that entitlement reform represents the only sustainable path to fiscal balance. Democratic proposals more frequently emphasize progressive taxation and targeted spending increases to address social needs while closing tax loopholes.
These competing visions have created legislative gridlock on fiscal policy throughout recent years. Comprehensive deficit reduction requires bipartisan cooperation that has proven elusive, particularly during election years when political positioning takes precedence over policy compromise.
Observers at U.S. Presidential Report note that fiscal policy has become increasingly entangled with broader partisan battles, making technical economic questions subject to ideological litmus tests that complicate evidence-based policymaking.
Potential policy approaches include:
- Gradual increases in retirement ages for Social Security and Medicare
- Means-testing benefits for higher-income recipients
- Revenue increases through base-broadening tax reform
- Discretionary spending caps with enforcement mechanisms
- Healthcare cost containment through payment reform
Historical Context and Comparative Analysis
Placing current deficit levels in historical perspective helps illuminate both the magnitude of today's challenges and potential pathways forward. The United States has experienced deficit cycles throughout its history, with wartime spending, economic recessions, and policy choices all contributing to fiscal outcomes.
The post-World War II era saw deficits spike during major conflicts and recessions, then decline during peacetime economic expansions. This pattern held through the Korean War, Vietnam War, and early Cold War period. However, starting in the 1980s, structural deficits became persistent even during economic growth.
Deficit Trends Across Administrations
Different presidential administrations have presided over varying deficit trajectories, though attributing fiscal outcomes solely to executive leadership oversimplifies complex economic and political dynamics. Congress controls appropriations, economic conditions heavily influence revenue and spending, and policy effects often lag their implementation.
Recent administrations have struggled with deficit reduction despite periodic promises to restore fiscal balance. The 1990s represented the last sustained period of deficit decline, culminating in brief surpluses at the turn of the millennium. Since then, deficits have trended higher across both Republican and Democratic administrations.
The COVID-19 pandemic dramatically accelerated deficit growth as emergency spending measures exceeded $5 trillion between 2020 and 2022. While some pandemic programs have expired, baseline spending and debt service costs remain elevated, contributing to the federal budget deficit 2026 analysis showing persistent structural imbalances.
Readers interested in how presidential fiscal policies have evolved can explore additional context regarding presidential economic policies and their impacts on deficit trajectories.
Economic Implications and Market Reactions
Large and persistent federal deficits carry significant economic implications beyond government finance. Deficit spending influences interest rates, credit markets, inflation dynamics, and international capital flows in ways that affect all Americans regardless of their direct interaction with government programs.
Interest Rate Effects
Economic theory suggests that sustained government borrowing can crowd out private investment by increasing demand for loanable funds and driving up interest rates. However, this relationship depends on numerous factors including Federal Reserve policy, global capital flows, and private sector savings behavior.
Current conditions present a complex picture. Despite elevated deficits, long-term interest rates remain below levels seen during previous high-deficit periods in the 1980s and early 1990s. Global demand for Treasury securities, the dollar's reserve currency status, and demographic trends toward higher savings rates all influence these outcomes.
Key market considerations include:
- Treasury yield curve dynamics and inversion risks
- Credit rating agency assessments of U.S. sovereign debt
- Foreign holdings of U.S. government securities
- Inflation expectations and real interest rate calculations
- Corporate borrowing costs and investment decisions
International Comparisons and Sovereign Debt
Examining how U.S. fiscal conditions compare with other advanced economies provides useful context for the federal budget deficit 2026 analysis. While many developed nations face similar demographic and spending pressures, their fiscal positions vary considerably based on prior policy choices and economic structures.
Japan maintains debt-to-GDP ratios exceeding 250 percent, far higher than U.S. levels, while also experiencing different economic dynamics including deflation risks and extremely low interest rates. European nations face constraints from monetary union membership that limit fiscal flexibility in ways not applicable to the United States.
Academic research, including studies on sovereign debt composition and maturity structure, offers theoretical frameworks for understanding long-run debt sustainability. These models examine how governments balance rollover risk, interest rate exposure, and fiscal flexibility through strategic debt management.
The United States benefits from unique advantages including the dollar's reserve currency status, deep and liquid Treasury markets, and strong institutional credibility. These factors provide greater fiscal space than most nations enjoy, though they do not eliminate constraints entirely.
| Country | Debt-to-GDP Ratio | 2026 Deficit Projection |
|---|---|---|
| United States | 123% | 6.2% of GDP |
| Japan | 264% | 4.1% of GDP |
| Germany | 68% | 1.2% of GDP |
| United Kingdom | 101% | 3.8% of GDP |
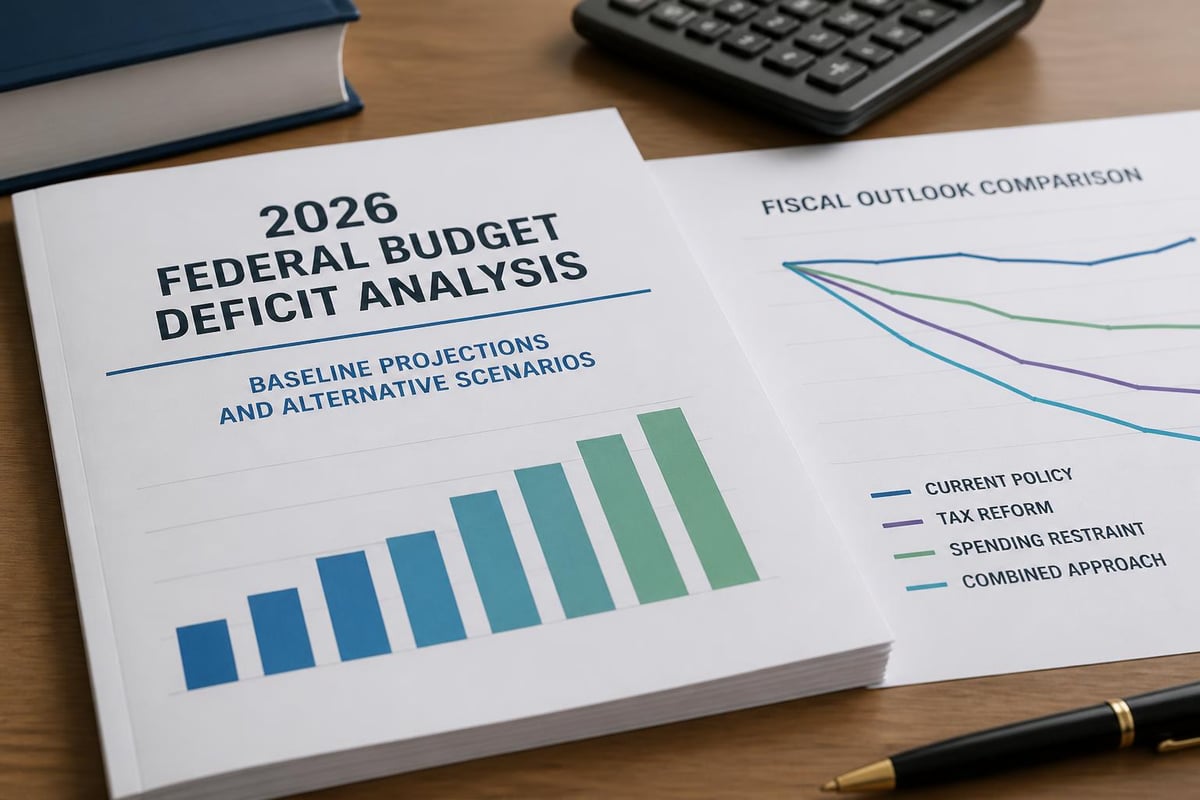
Long-Term Fiscal Sustainability Concerns
Beyond immediate annual deficits, long-term fiscal sustainability presents even more daunting challenges. CBO projections extending through 2050 show debt-to-GDP ratios rising to unprecedented peacetime levels absent significant policy changes.
These long-run projections account for known demographic trends, existing spending commitments, and revenue structures under current law. They reveal that absent policy intervention, interest costs alone could consume the majority of federal revenue within several decades, leaving insufficient resources for other government functions.
Demographic Headwinds
Population aging represents the single largest driver of long-term fiscal pressure. As the ratio of workers to retirees declines, fewer taxpayers must support growing numbers of beneficiaries. This fundamental arithmetic creates unavoidable fiscal stress regardless of which political party controls government.
By 2040, Americans aged 65 and older will comprise nearly 22 percent of the population, up from 17 percent in 2020. This demographic shift reflects increased life expectancy and the movement of large birth cohorts into retirement, creating sustained pressure on retirement and healthcare programs.
Long-term fiscal challenges include:
- Social Security trust fund depletion projected for early 2030s
- Medicare Hospital Insurance trust fund facing similar timeline
- Rising healthcare costs per beneficiary exceeding GDP growth
- Declining labor force participation rates
- Productivity growth insufficient to offset demographic trends
Addressing these challenges requires difficult policy choices that extend beyond typical political cycles. The federal budget deficit 2026 analysis serves as an early warning of pressures that will intensify absent corrective action.
Congressional Budget Office Methodology
Understanding how deficit projections are constructed helps contextualize their meaning and limitations. The CBO employs rigorous economic modeling and detailed program analysis to generate baseline budget projections used throughout policy debates.
The CBO’s comprehensive reports detail methodological approaches, economic assumptions, and uncertainty ranges surrounding central estimates. These projections assume current law continues unchanged, providing a neutral baseline for evaluating proposed policy alternatives.
Key assumptions include economic growth rates, inflation projections, interest rate paths, and demographic trends. Small changes in these parameters can significantly alter deficit projections over multi-year horizons, creating inherent uncertainty in fiscal forecasts.
CBO projections incorporate:
- Dynamic scoring of major legislation
- Stochastic modeling for uncertainty analysis
- Historical precedent and regression analysis
- Expert consultation across agencies and institutions
- Regular updates reflecting new data and policy changes
Political actors sometimes criticize CBO projections when they conflict with preferred policy narratives. However, the office's nonpartisan professional staff maintains institutional credibility through transparent methodology and consistent application of analytical frameworks across different proposals regardless of partisan origin.
Deficit Impact on Federal Programs
Rising deficits and debt service costs create competitive pressures on discretionary spending programs funded through annual appropriations. As mandatory spending and interest consume larger budget shares, appropriators face difficult choices about funding levels for defense, education, infrastructure, research, and other priorities.
This crowding-out effect operates through political constraints as much as economic ones. Voters and policymakers increasingly recognize that deficit financing has limits, creating pressure to hold discretionary spending flat or reduce it in real terms even as program demands grow.
Defense spending represents the largest discretionary category at approximately $850 billion in 2026. Military leaders argue that modernization needs and strategic competition require sustained investment, while deficit hawks emphasize that defense cannot remain exempt from fiscal discipline.
Non-defense discretionary spending covers a vast array of programs including transportation infrastructure, scientific research, education grants, law enforcement, environmental protection, and foreign aid. These programs collectively total roughly $700 billion but face persistent pressure to accommodate deficit reduction demands.
For those following how fiscal policy intersects with broader governance questions, U.S. Presidential Report provides ongoing coverage of budget debates and their political implications.
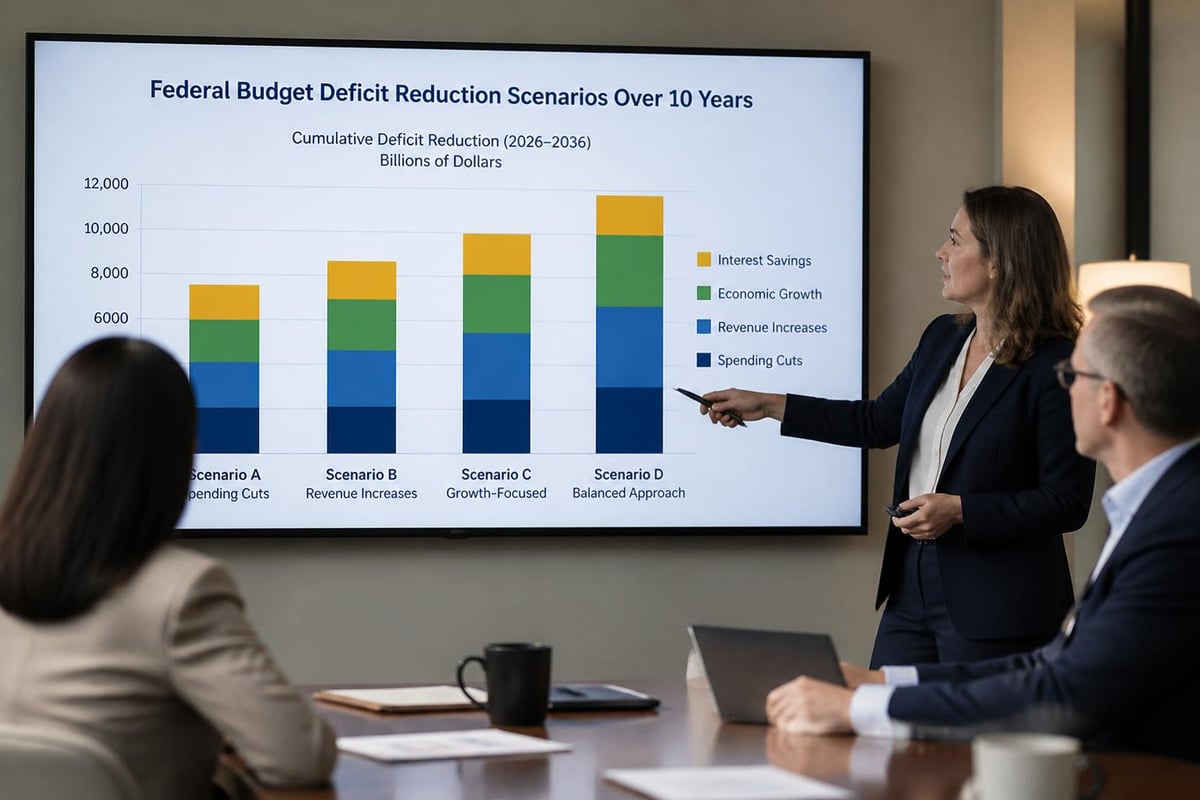
Reform Proposals and Political Feasibility
Numerous deficit reduction proposals circulate among think tanks, advocacy organizations, and congressional offices. These range from comprehensive grand bargains addressing both spending and revenue to targeted reforms of specific programs or tax provisions.
Common reform categories include:
- Entitlement program adjustments through eligibility or benefit modifications
- Tax expenditure elimination or limitation to broaden revenue base
- Healthcare delivery system reforms to reduce per-beneficiary costs
- Defense acquisition reform and force structure adjustments
- Discretionary spending caps with automatic enforcement
Political feasibility represents the binding constraint on deficit reduction more than technical policy design. Numerous commissions and expert panels have outlined sustainable fiscal paths, but implementing their recommendations requires overcoming intense political opposition from affected stakeholders.
The 2010 Simpson-Bowles commission proposed comprehensive deficit reduction combining spending restraint and revenue increases. Despite broad expert support, political leaders from both parties rejected key elements, illustrating how policy knowledge alone cannot overcome political economy obstacles.
Fiscal Rules and Budget Process Reform
Some analysts argue that structural budget process reforms could help constrain deficit growth by changing institutional incentives. Proposals include constitutional balanced budget amendments, statutory spending caps, PAYGO rules requiring offsets for new spending or tax cuts, and enhanced presidential rescission authority.
Critics contend that fiscal rules often prove ineffective when political will to circumvent them emerges. Numerous statutory budget controls enacted over past decades have been waived, modified, or ignored when they conflicted with immediate political priorities.
International experience with fiscal rules offers mixed lessons. Some countries have maintained stricter fiscal discipline through constitutional debt brakes or independent fiscal councils with enforcement powers. However, successful examples typically reflect broader political consensus supporting fiscal restraint rather than rules alone compelling it.
| Reform Approach | Theoretical Strength | Political Feasibility | Historical Effectiveness |
|---|---|---|---|
| Balanced Budget Amendment | Very High | Very Low | N/A (never enacted) |
| Statutory Spending Caps | Moderate | Moderate | Low (frequently waived) |
| PAYGO Requirements | Moderate | Moderate | Low (often circumvented) |
| Independent Fiscal Council | Moderate | Low | Mixed (varies by country) |
The federal budget deficit 2026 analysis reveals persistent structural imbalances requiring sustained policy attention across multiple administrations and congressional sessions. While short-term political incentives often discourage difficult fiscal choices, demographic trends and compound interest dynamics ensure these challenges will intensify without corrective action. For comprehensive, non-partisan coverage of how presidential administrations and Congress navigate these critical fiscal policy debates, U.S. Presidential Report provides timely analysis and historical context to help citizens understand the governance decisions shaping America's economic future.